Fig. 9
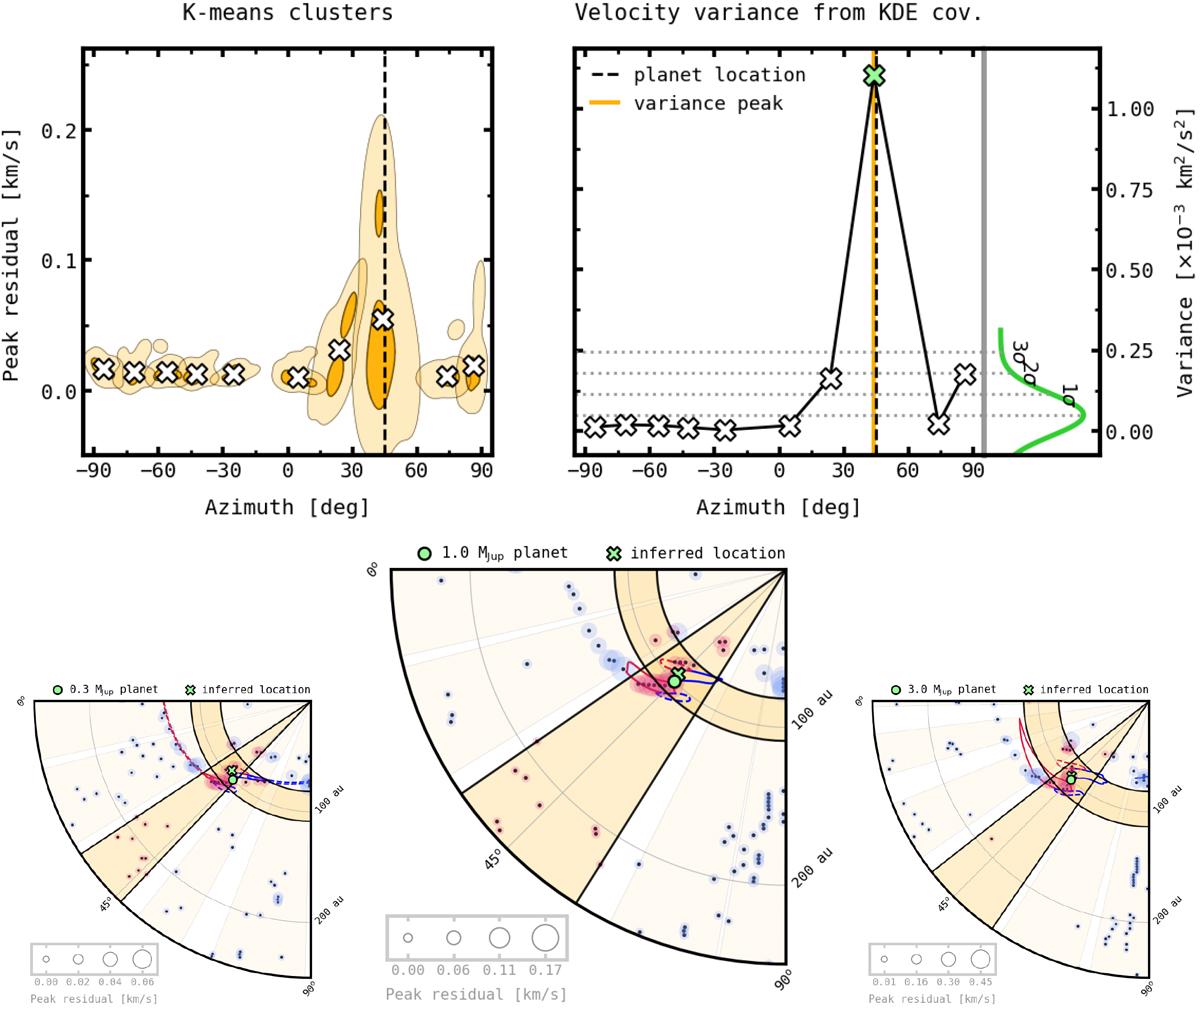
Top row, left panel: KDE contours derived from K-means clusters of peak velocity residuals for the (1.0 MJup, ϕp = 45°) snapshot. The contours enclose 33 and 95 per cent of the peak residuals. The white crosses are the cluster centres retrieved by the K-means algorithm. Right panel: spectral variance of peak residuals for each cluster on the left. In the panel attached on the right we show 1, 2, and 3σ significance thresholds. The yellow line highlights the azimuthal location of the peak variance and the dashed line the actual location of the planet. The green cross is the peak variance significant enough to be attributed to the planet perturbation. Bottom row: 2D visualisation of the detection using the Variance Peak method for three planets (0.3, 1.0 and 3.0 MJup), all at ϕp = 45° azimuth and Rp = 100 au radius. The green circles and crosses are the actual and inferred location of the planets, respectively. The highlighted sectors are the azimuthal and radial clusters with the highest spectral variance extracted by the method. The boundaries of the sectors mark the maximum spatial coverage of the clusters. The circles show the location of the observed peak velocity residuals, whose magnitude is indicated by their size. The red circles are residuals within the azimuthal or radial peak variance clusters. The solid (δυϕ) and dashed (υR) contours trace spiral wakes and radial planet perturbations, and correspond to 60 per cent peak velocity fluctuations extracted from the simulation velocities.
Current usage metrics show cumulative count of Article Views (full-text article views including HTML views, PDF and ePub downloads, according to the available data) and Abstracts Views on Vision4Press platform.
Data correspond to usage on the plateform after 2015. The current usage metrics is available 48-96 hours after online publication and is updated daily on week days.
Initial download of the metrics may take a while.