Fig. 8
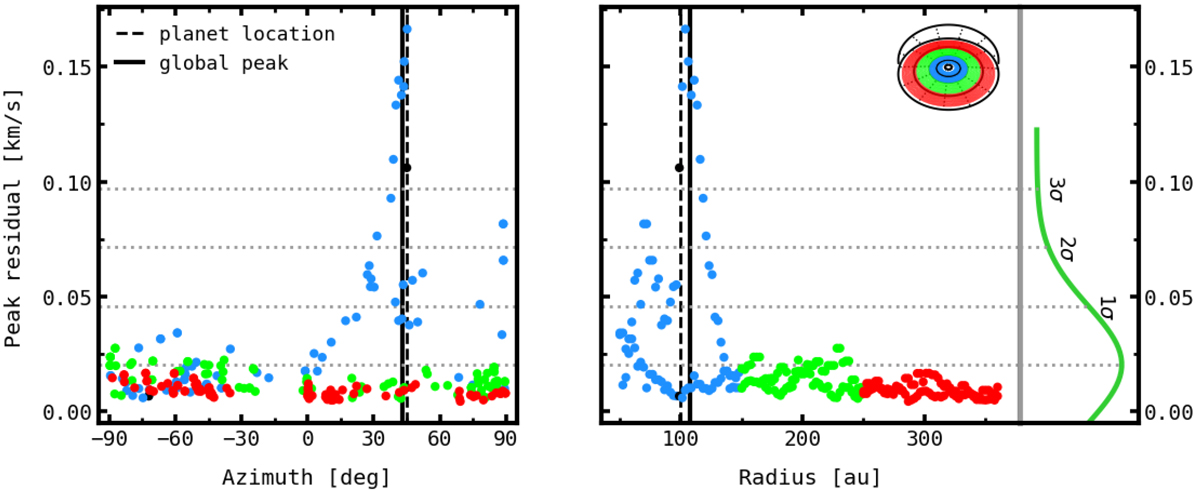
Left panel: peak residuals and their azimuthal location for the (1.0 MJup, ϕp = 45°) snapshot. Right panel: peak residuals rearranged as a function of their radial distance. The panel on the right shows the peak residual distribution (green line) and 1, 2, and 3σ significance thresholds (dotted lines). The solid black lines are the azimuthal and radial location of the global peak, while the dashed black lines show the actual location of the planet.
Current usage metrics show cumulative count of Article Views (full-text article views including HTML views, PDF and ePub downloads, according to the available data) and Abstracts Views on Vision4Press platform.
Data correspond to usage on the plateform after 2015. The current usage metrics is available 48-96 hours after online publication and is updated daily on week days.
Initial download of the metrics may take a while.