Free Access
Fig. 4
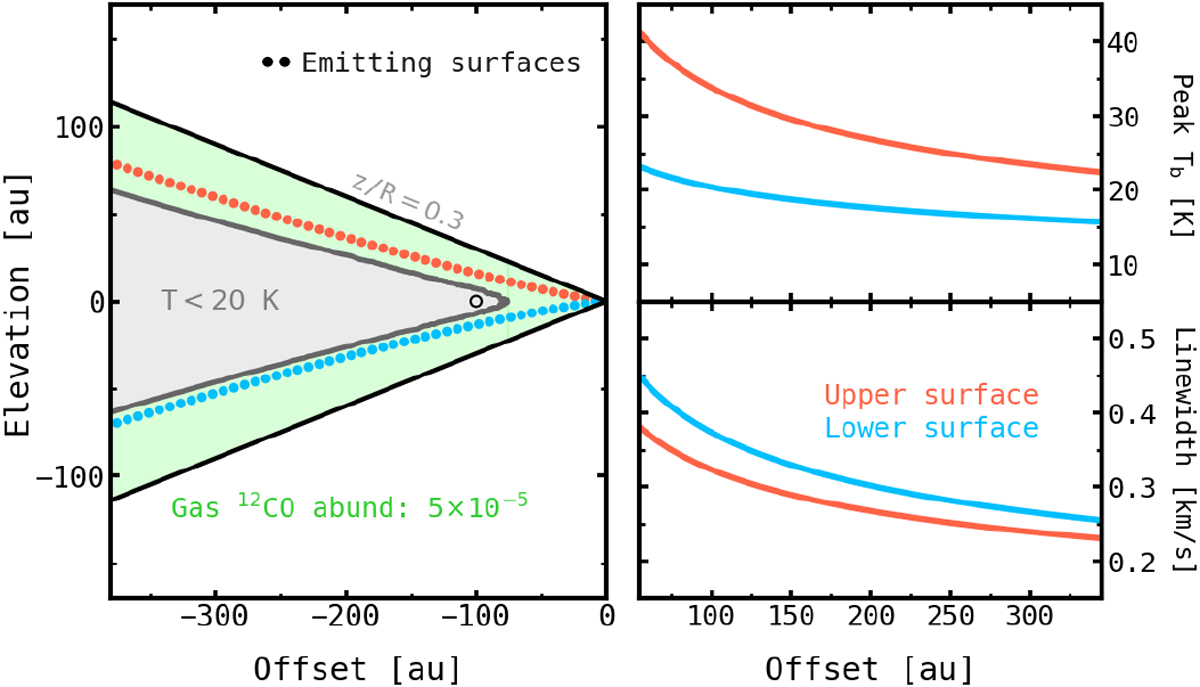
Best-fit attributes obtained by the DISCMINER for the 0.3 MJup snapshot. Left panel: freeze-out and gas phase regions for 12CO. The coloured circles indicate the height of the model emitting surfaces. Right panels: model peak brightness temperature and line width as a function of radius on both emitting surfaces.
Current usage metrics show cumulative count of Article Views (full-text article views including HTML views, PDF and ePub downloads, according to the available data) and Abstracts Views on Vision4Press platform.
Data correspond to usage on the plateform after 2015. The current usage metrics is available 48-96 hours after online publication and is updated daily on week days.
Initial download of the metrics may take a while.