Free Access
Fig. 3
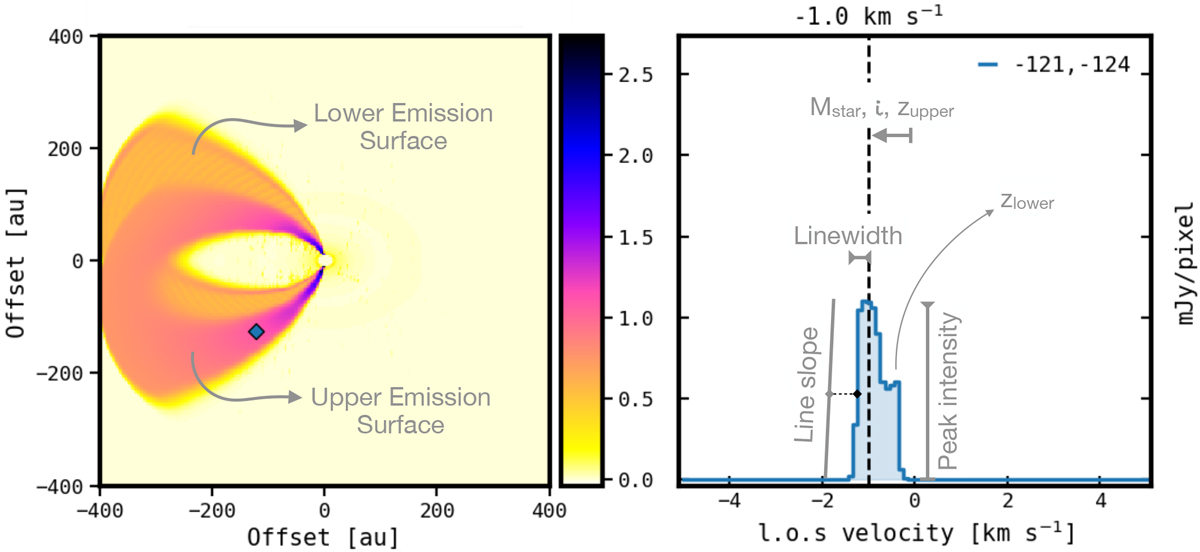
Summary of the main attributes making up the line emission of a disc in the DISCMINER. Left panel: projected intensity of the disc for a channel centred on υch = − 1.0 km s−1. Right panel:line intensity profile extracted from the marker on the left. The grey annotations indicate the role of each attribute listed in Table 1.
Current usage metrics show cumulative count of Article Views (full-text article views including HTML views, PDF and ePub downloads, according to the available data) and Abstracts Views on Vision4Press platform.
Data correspond to usage on the plateform after 2015. The current usage metrics is available 48-96 hours after online publication and is updated daily on week days.
Initial download of the metrics may take a while.