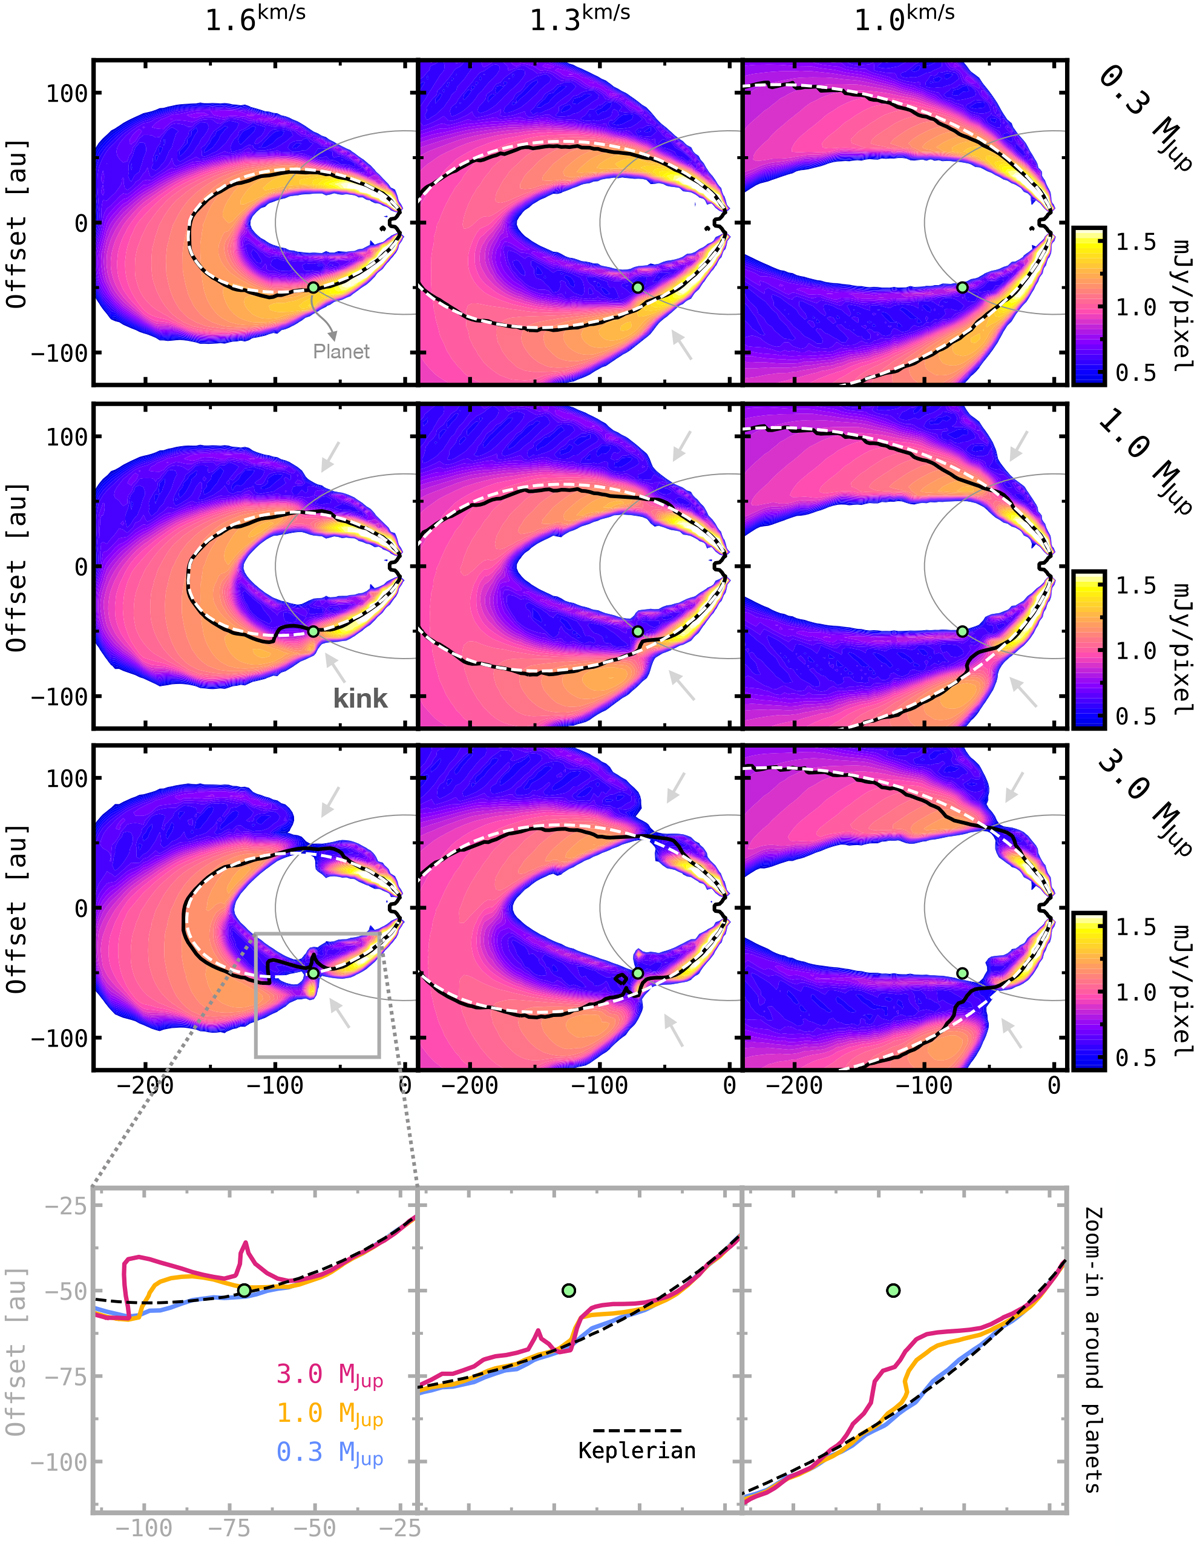
Fig. 2

Selected 12CO J = 2−1 synthetic channel maps for the three simulation snapshots (0.3, 1.0 and 3.0 MJup, from top to bottom), with the planets at Rp = 100 au radius, and ϕp = 45° azimuth, marked as green circles. The disc is inclined at − 45° with respect to the plane of the sky. The thin grey line is the projected circular orbit of the planet. The solid lines are centroid velocity contours extracted from the simulations at the velocity channel indicated on the top header; the dashed lines show the same but for the Keplerian best-fit model. Small arrows indicate kink-like features identified by visual inspection. In the bottom row a zoom-in around planets is shown for better comparison of centroid velocities and their deviation from Keplerian rotation as a function of planet mass.
Current usage metrics show cumulative count of Article Views (full-text article views including HTML views, PDF and ePub downloads, according to the available data) and Abstracts Views on Vision4Press platform.
Data correspond to usage on the plateform after 2015. The current usage metrics is available 48-96 hours after online publication and is updated daily on week days.
Initial download of the metrics may take a while.


