Fig. A.2
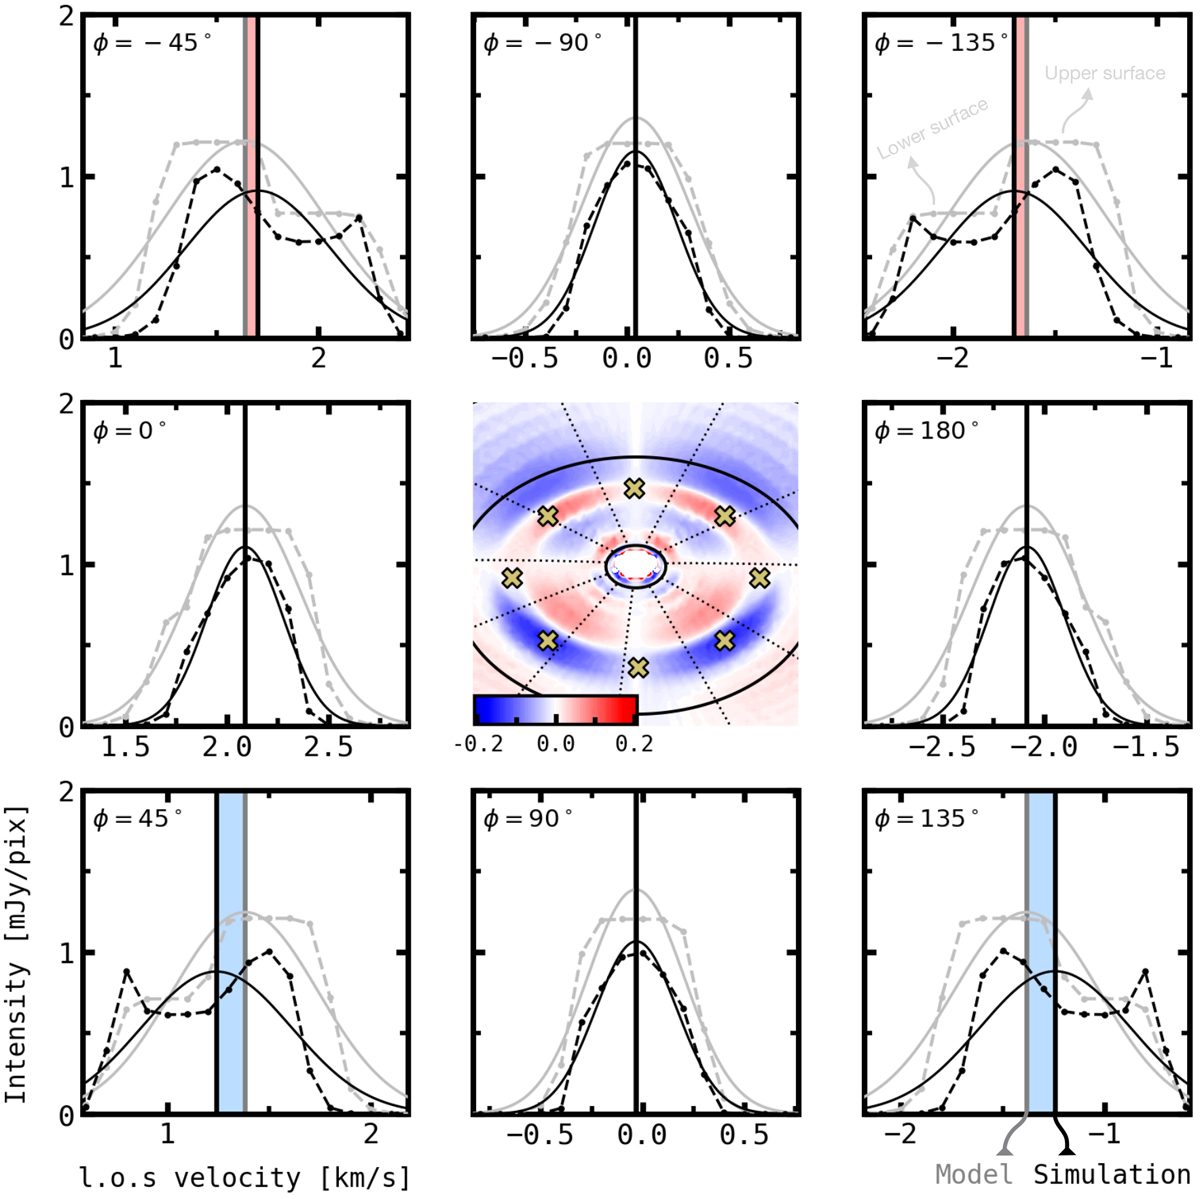
Comparison between simulation (dashed black) and model intensity profiles (dashed grey) extracted from different azimuths in the gap. Asymmetric line profiles are due to the contribution of both upper and lower emitting surfaces as indicated in the top right panel, whereas symmetric profiles are shaped bythe upper surface only. The solid black and grey lines are the Gaussian fits of the profiles and the vertical lines are the associated line centroids. Middle panel: centroid velocity residuals, in km s−1, zoomed-in on the central region of the Keplerian disc of Fig. A.1. The crosses are all at R = 100 au, and indicate the exact location of the intensity profiles in the surrounding panels. The gap was initially carved by a 1.0 MJup planet; thenthe planet was removed and the gas velocity set to be fully Keplerian for this analysis. The model, on the other hand, does not contain a gap, and so it systematically overestimates peak intensities there. Even though the disc rotation is Keplerian, there are high centroid velocity residuals due to differences between the simulation and model intensities. This effect appears all over the gap where the line profiles are asymmetric due to the contribution of the lower surface of the disc.
Current usage metrics show cumulative count of Article Views (full-text article views including HTML views, PDF and ePub downloads, according to the available data) and Abstracts Views on Vision4Press platform.
Data correspond to usage on the plateform after 2015. The current usage metrics is available 48-96 hours after online publication and is updated daily on week days.
Initial download of the metrics may take a while.