Fig. A.1
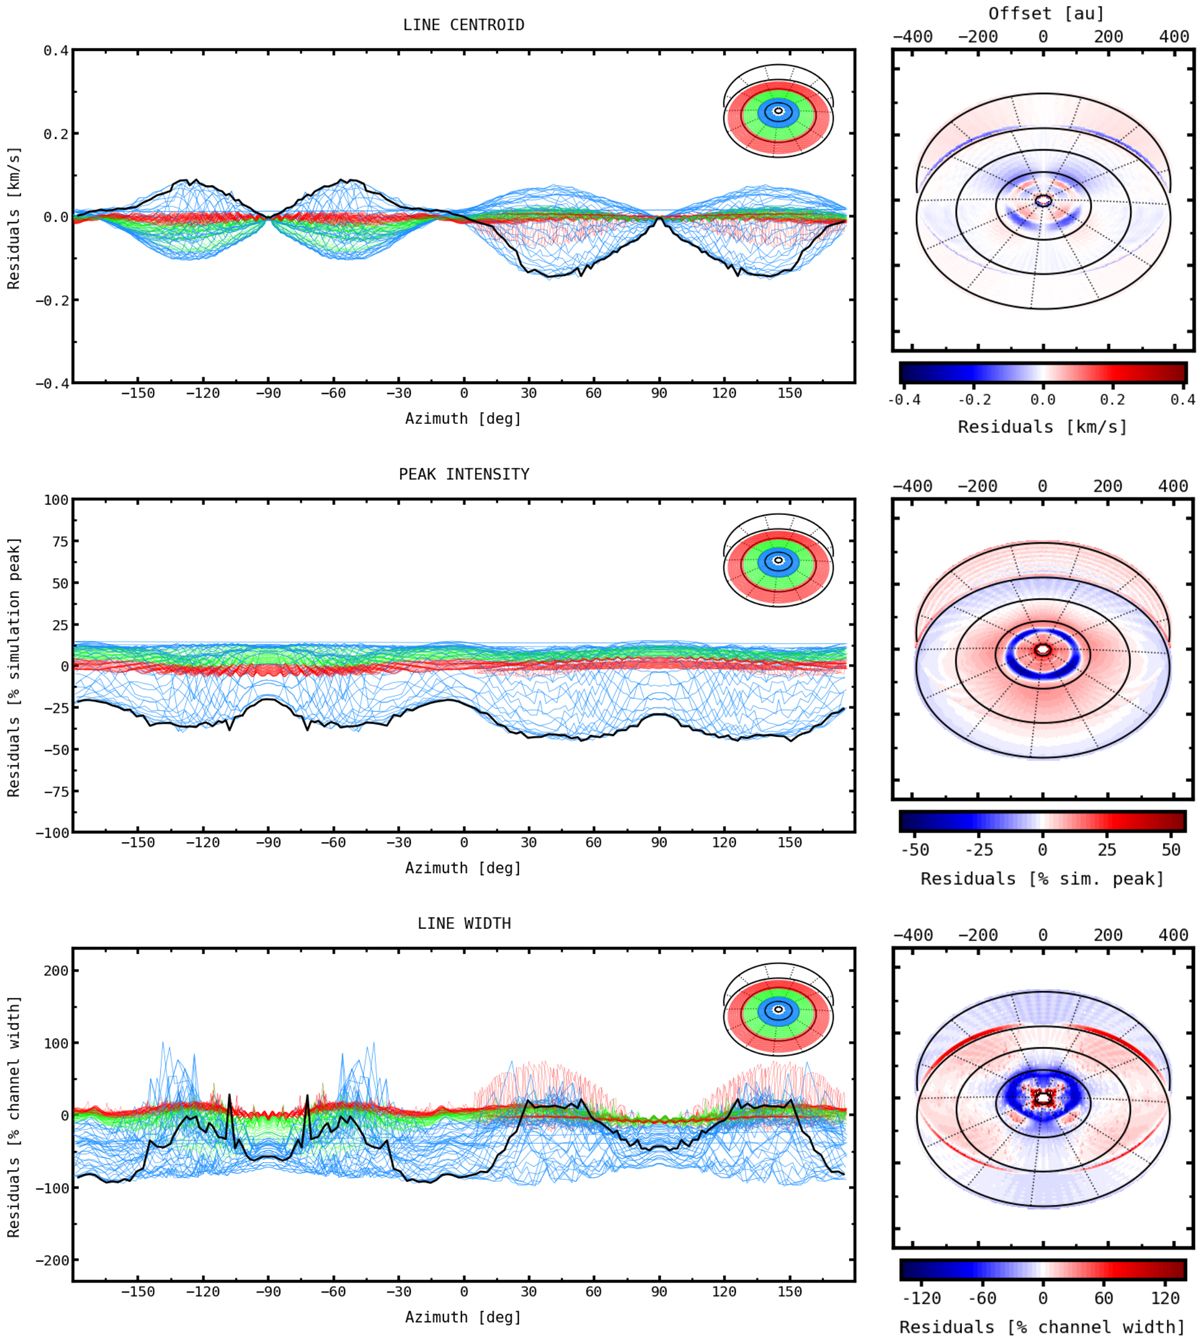
Line centroid (top), peak intensity (middle), and line width (bottom) residuals for the 1.0 MJup snapshot. The planet was removed and the gas velocity set to be fully Keplerian in order to analyse the contribution of the gas gap alone. The azimuthal scans on the left run along constant radii contours, whose colours represent their closeness to the gap, centred at R = 100 au. Although the velocities are Keplerian, the high (symmetric) centroid velocity residuals remain due to intensity differences between simulation and model at the location of the gap (see Fig. A.2). By simple comparison with Fig. 6, it is easy to identify the impact of the planet on the intensity and velocity residuals.
Current usage metrics show cumulative count of Article Views (full-text article views including HTML views, PDF and ePub downloads, according to the available data) and Abstracts Views on Vision4Press platform.
Data correspond to usage on the plateform after 2015. The current usage metrics is available 48-96 hours after online publication and is updated daily on week days.
Initial download of the metrics may take a while.