Fig. 12
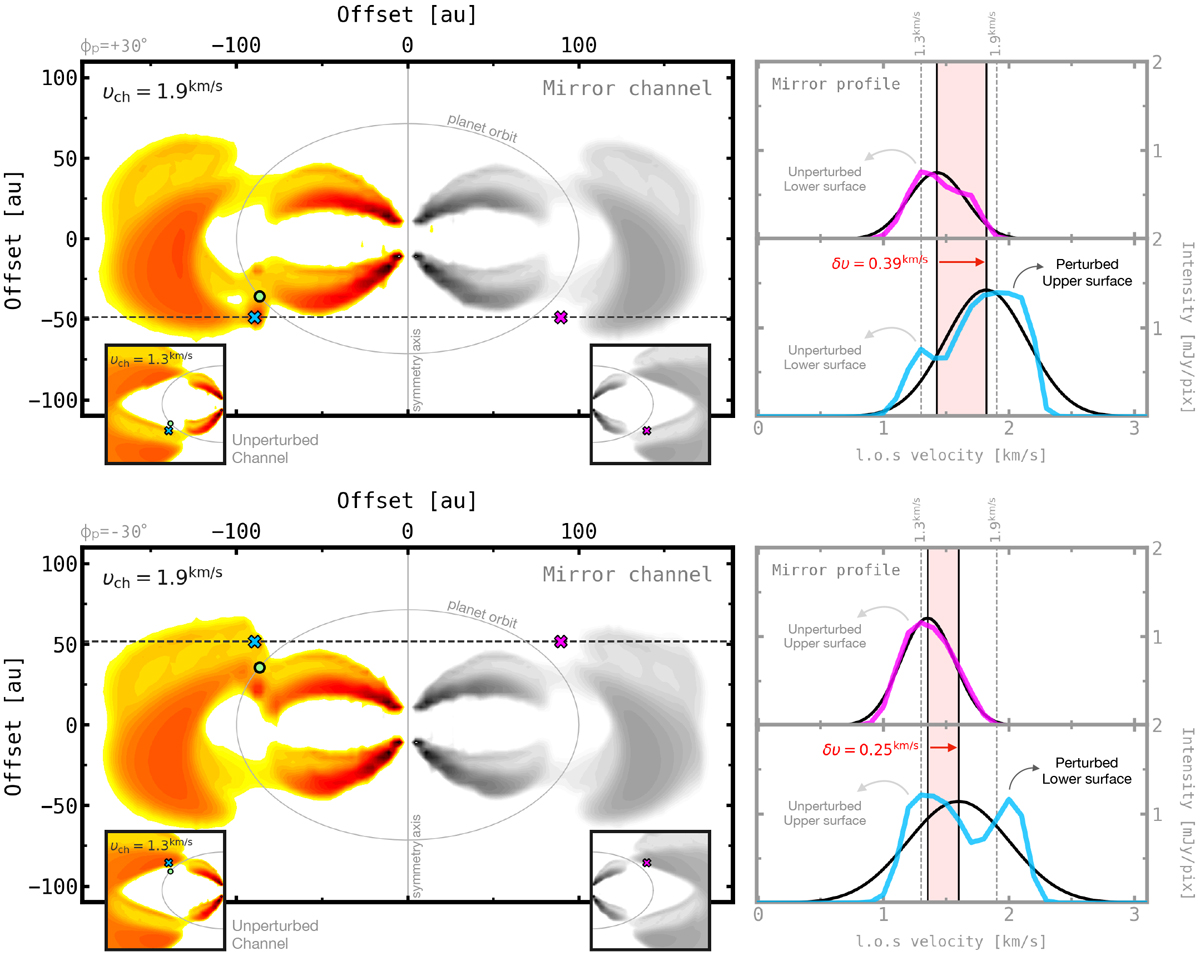
Illustrating how line centroids are shifted towards faster velocities around a 3.0 MJup planet, at two azimuths ϕp = ±30°. The crosses on the left indicate the location of the line profiles with the same colours on the right. The blue cross is the location of the observed peak perturbation, and the pink cross is the mirror pixel at the other side of the disc. We note that depending on the planet azimuth, the peak perturbation is projected either on the upper or on the lower emitting surface, which contribute differently to the observed line profiles. This contrast leads to variations in the observed line centroids (vertical black lines on the right) and the retrieved velocity fluctuations (in red).
Current usage metrics show cumulative count of Article Views (full-text article views including HTML views, PDF and ePub downloads, according to the available data) and Abstracts Views on Vision4Press platform.
Data correspond to usage on the plateform after 2015. The current usage metrics is available 48-96 hours after online publication and is updated daily on week days.
Initial download of the metrics may take a while.