Free Access
Fig. 10
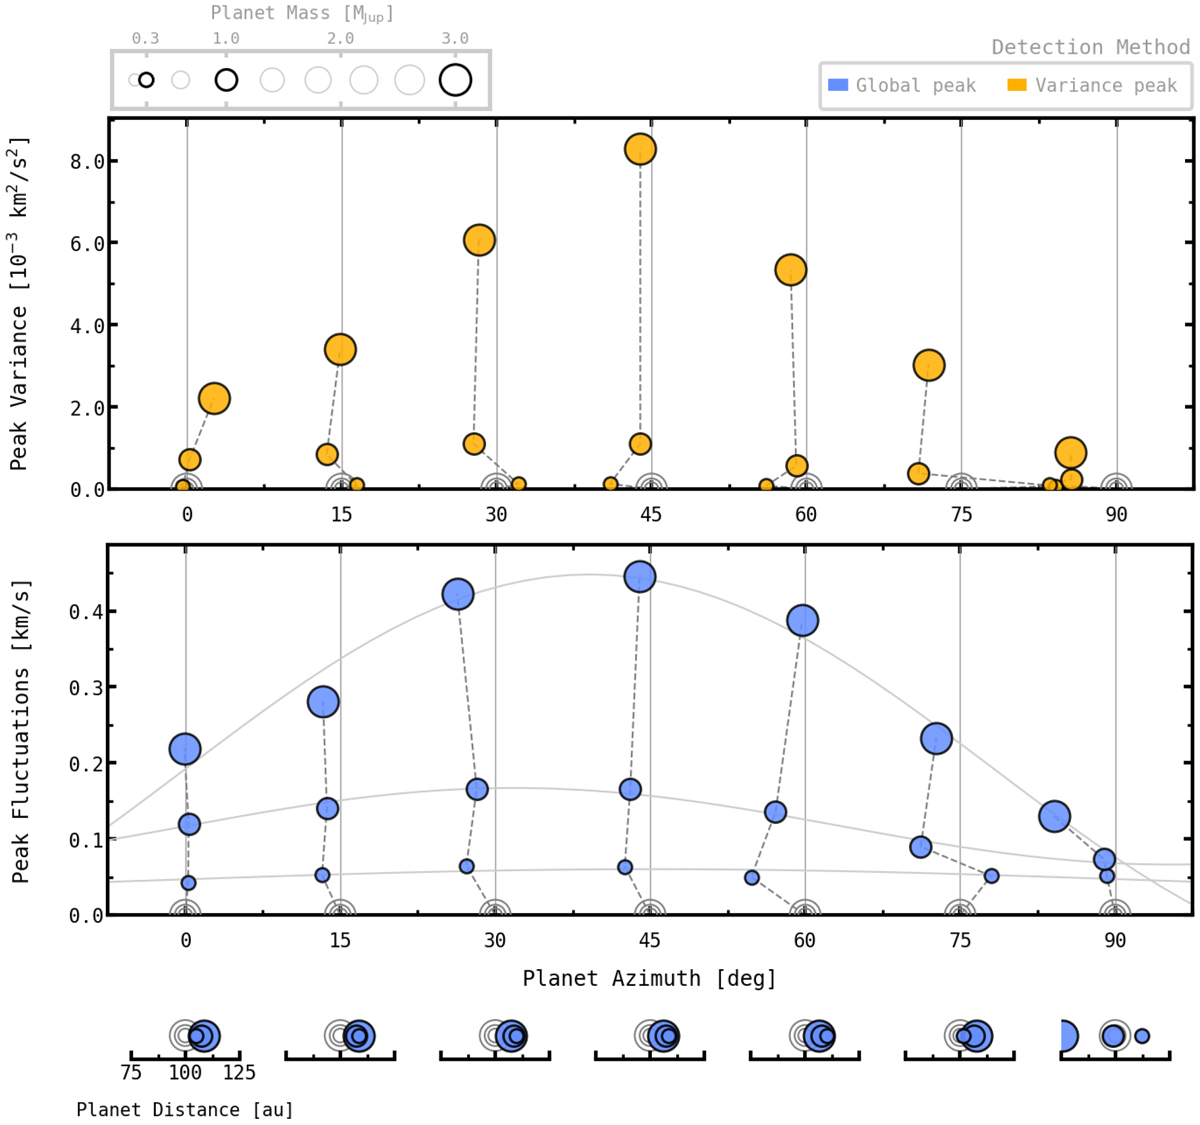
Peak variance and peak velocity fluctuations extracted with the Variance and Global peak methods as a function of the detected planet azimuth for all three planet masses. The detected radial distance is shown in the bottom panels. Empty circles indicate the actual locations of planets.
Current usage metrics show cumulative count of Article Views (full-text article views including HTML views, PDF and ePub downloads, according to the available data) and Abstracts Views on Vision4Press platform.
Data correspond to usage on the plateform after 2015. The current usage metrics is available 48-96 hours after online publication and is updated daily on week days.
Initial download of the metrics may take a while.