Fig. 1
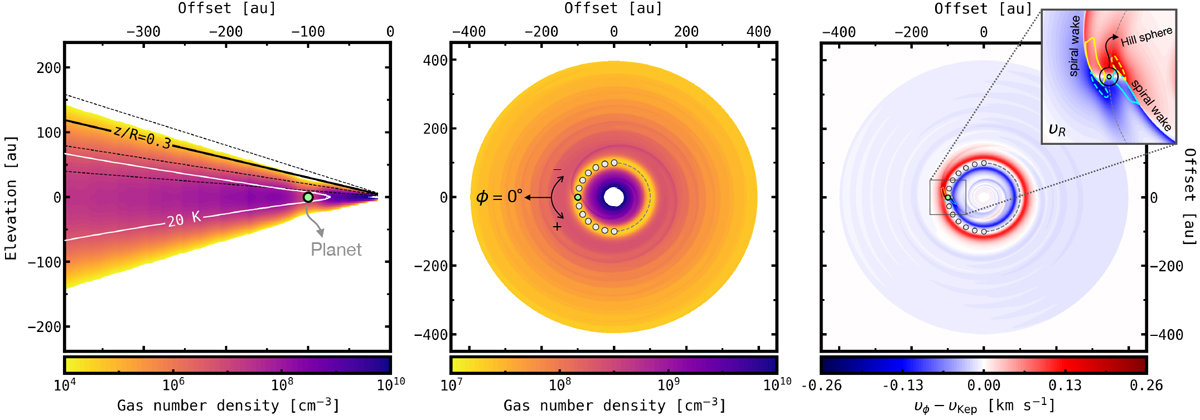
Left panel: edge-on gas number density of one of our planet–disc simulation snapshots (1.0 MJup, ϕp = 0°). The white contour encloses the CO freeze-out region (T < 20 K). The black lines correspond to z∕R = 0.1, 0.2, 0.3, 0.4 scale heights, with the solid line being the threshold adopted for photodissociation. Middle panel: face-on view of the gas number density in the midplane of the disc. Right panel: azimuthal (main panel) and radial (zoom-in) deviations from Keplerian velocity. The solid and dashed contours in the zoomed-in panel are ±60 per cent peak azimuthal and peak radial perturbations, respectively, and illustrate that both components do not necessarily overlap and in turn contribute independently to the observed peak velocity perturbations. Also shown is the planet Hill sphere, with a radius of 6.8 au. The green circle indicates the current position of the planet, and the grey circles are additional planet azimuths explored in this work.
Current usage metrics show cumulative count of Article Views (full-text article views including HTML views, PDF and ePub downloads, according to the available data) and Abstracts Views on Vision4Press platform.
Data correspond to usage on the plateform after 2015. The current usage metrics is available 48-96 hours after online publication and is updated daily on week days.
Initial download of the metrics may take a while.