Fig. A.1.
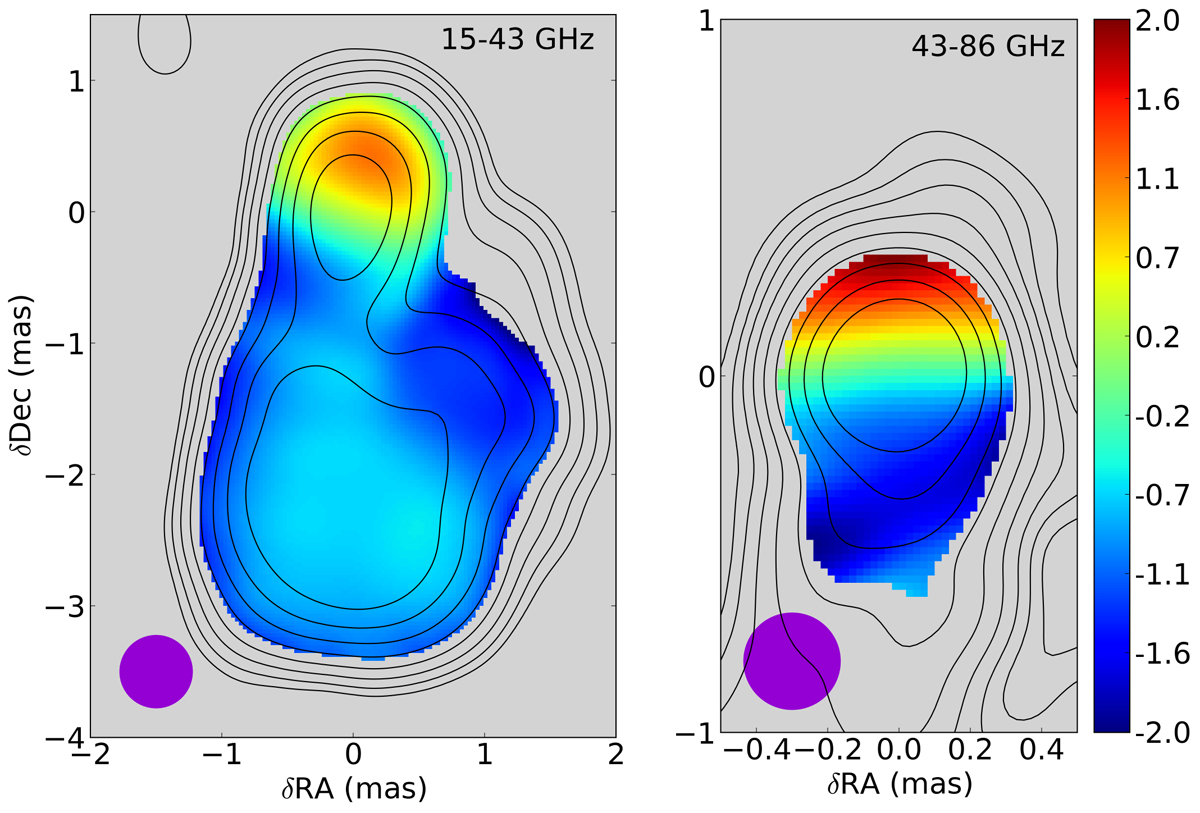
Spectral index maps after image alignment, convolved with a beam of a radius equal to the geometric mean of the lower-frequency map beam (see Table A.1). Left panel: 15 GHz image in contours and the 15−43 GHz spectral index in colours. The contours start at 4.41 mJy beam−1 and increase with a factor of two. The spectral index map is convolved with a circular beam of 0.55 mas. Right panel: we zoomed in on the nuclear region of the 43−86 GHz spectral index image, shown in colour to better illustrate the spectral index gradient. The contours start at 4.38 mJy beam−1, corresponding to the 43 GHz image, and increase in steps of two. The spectral index map is convolved with a circular beam of 0.27 mas. We apply the same cutoffs as in Fig. 1.
Current usage metrics show cumulative count of Article Views (full-text article views including HTML views, PDF and ePub downloads, according to the available data) and Abstracts Views on Vision4Press platform.
Data correspond to usage on the plateform after 2015. The current usage metrics is available 48-96 hours after online publication and is updated daily on week days.
Initial download of the metrics may take a while.