Fig. 5.
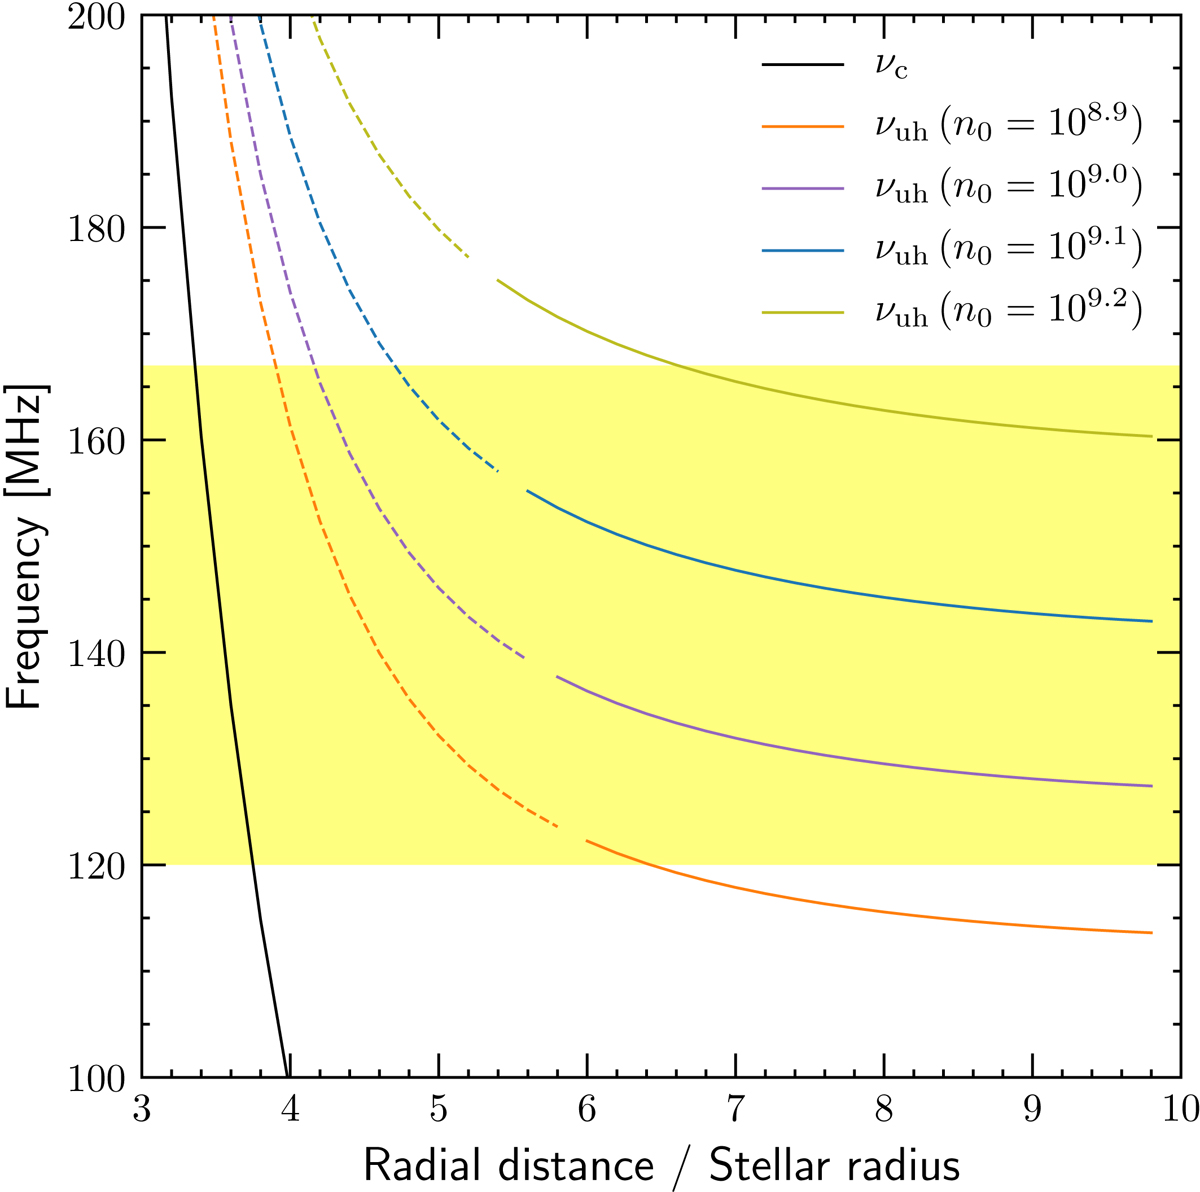
Radial profile of the cyclotron frequency (solid black line) and the upper hybrid plasma frequency (coloured lines) for different base plasma density values given in units of cm−3. The plasma has been assumed to follow a hydrostatic density structure along any given field line while taking centrifugal force into account (Havnes & Goertz 1984, their Eq. (3)). The broken lines denote regions where cyclotron absorption precludes radiation escape. The yellow band shows the observed frequency range.
Current usage metrics show cumulative count of Article Views (full-text article views including HTML views, PDF and ePub downloads, according to the available data) and Abstracts Views on Vision4Press platform.
Data correspond to usage on the plateform after 2015. The current usage metrics is available 48-96 hours after online publication and is updated daily on week days.
Initial download of the metrics may take a while.