Fig. 4.
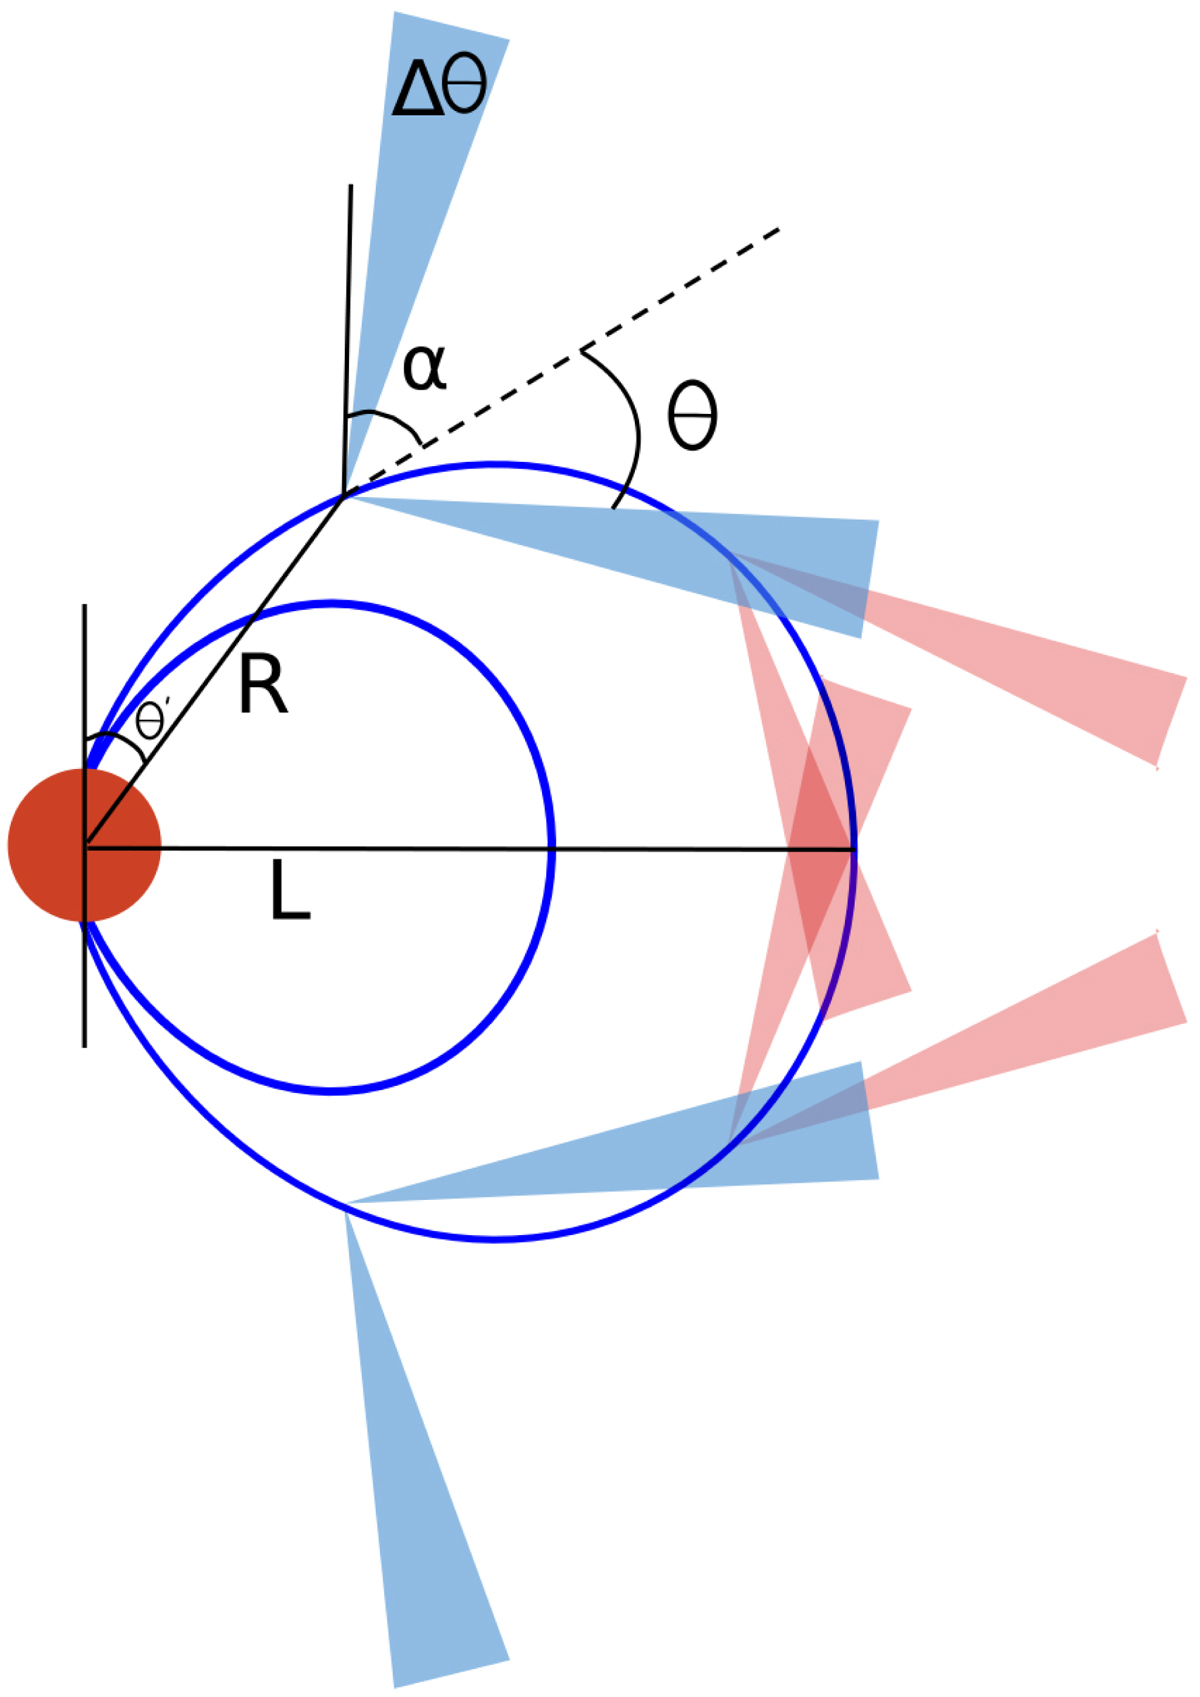
Not-to-scale sketch showing the geometry of cyclotron maser emission on a single dipolar field line that lies in the plane of the page. The higher frequency emission cone (blue) is oriented at a smaller polar angle, α, when compared to the emission cone at a lower frequency (red). Here, L is the distance to the field line for a polar angle of 0°, R is the distance from the star’s centre to the emission cone along the field line, θ is the angle between the direction of emission and the interior wall of the cone, and Δθ is the angular width of the emission cone’s wall. The effects of α and θ on the emission frequency has been exaggerated here and is not to scale for the LOFAR frequency range.
Current usage metrics show cumulative count of Article Views (full-text article views including HTML views, PDF and ePub downloads, according to the available data) and Abstracts Views on Vision4Press platform.
Data correspond to usage on the plateform after 2015. The current usage metrics is available 48-96 hours after online publication and is updated daily on week days.
Initial download of the metrics may take a while.