Fig. 3.
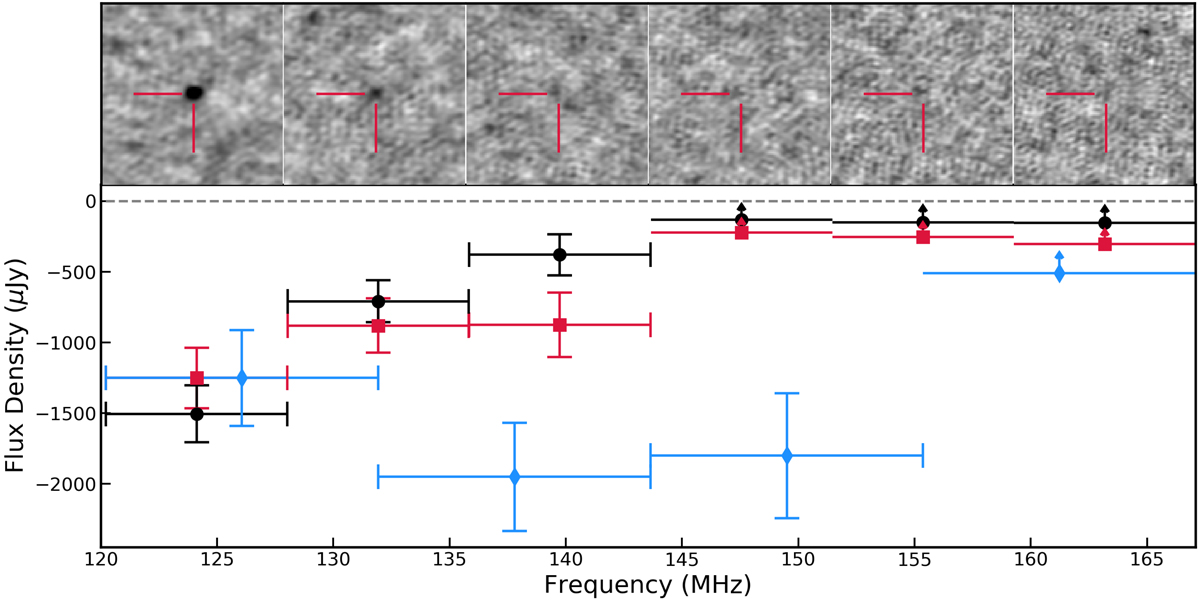
Stokes-V spectrum of WX UMa in the three independent exposures from the LoTSS survey observations. The three sets of points show the spectrum for the three independent exposures. Upper limits correspond to 1σ. The greyscale images were made from the P167+42 exposure (see Table 1) over 8 h of synthesis and ≈7.8 MHz of bandwidth. The red cross-hairs mark the position of WX UMa. The source consistently shows a drop in flux density magnitude above ≈150 MHz in all epochs suggesting that this is an enduring property of the emitter. We made a 3.5-σ detection of WX UMa when averaging over the last three bands in the P167+42 observation, suggesting that the spectral evolution at these higher frequencies is a low plateau rather than a cut-off.
Current usage metrics show cumulative count of Article Views (full-text article views including HTML views, PDF and ePub downloads, according to the available data) and Abstracts Views on Vision4Press platform.
Data correspond to usage on the plateform after 2015. The current usage metrics is available 48-96 hours after online publication and is updated daily on week days.
Initial download of the metrics may take a while.