Fig. 4
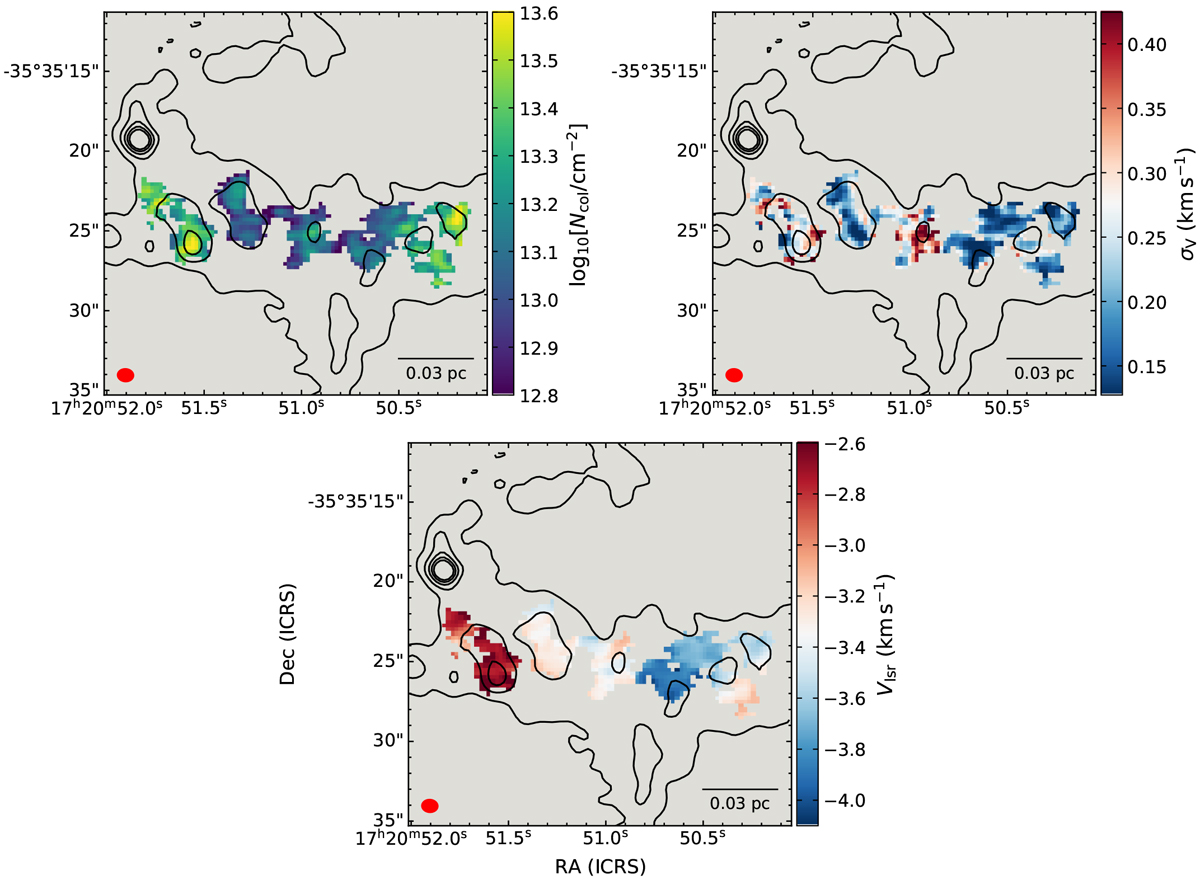
Maps of o-H2D+ column density (top left panel), σV (top right), and centroid velocity (bottom) obtained from the MCWEEDS analysis in the individual cores in AG351. The beam size and scale bar are shown in the bottom left and bottom right corners, respectively. The black contours show the continuum emission in Band 7 at levels [1, 5, 10, 15, 20] mJy beam−1.
Current usage metrics show cumulative count of Article Views (full-text article views including HTML views, PDF and ePub downloads, according to the available data) and Abstracts Views on Vision4Press platform.
Data correspond to usage on the plateform after 2015. The current usage metrics is available 48-96 hours after online publication and is updated daily on week days.
Initial download of the metrics may take a while.