Fig. 2
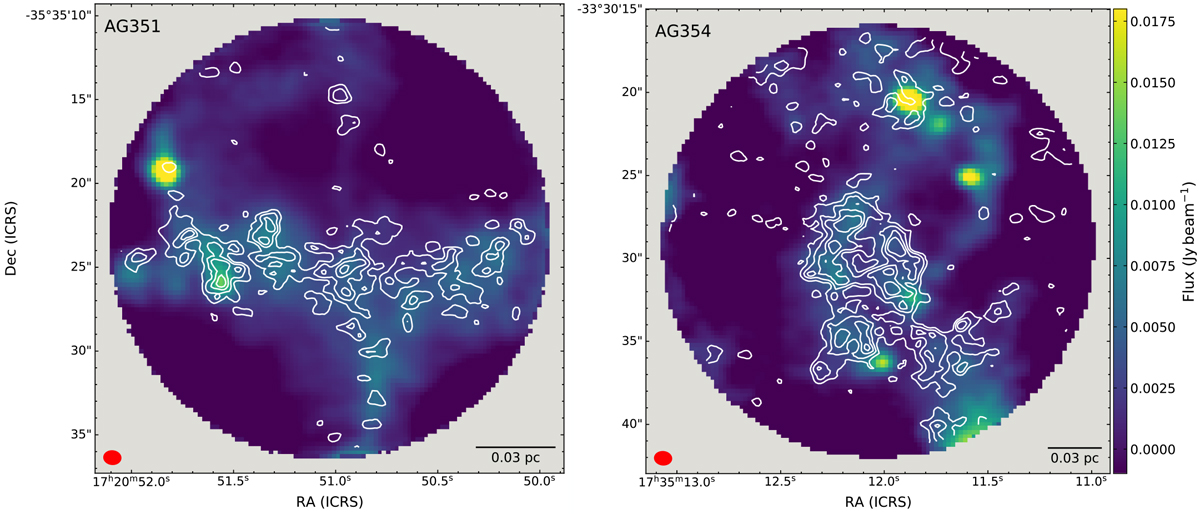
Map of the continuum emission as seen by ALMA in Band 7 in AG351 (left panel) and AG354 (right panel). The contours show the o-H2D+-integrated intensity emission from the original not re-gridded and not primary-beam-corrected data, at levels = [5, 7, 9, 11]σ, where 1σ = 60 mK km s−1 (AG351) and 70 mK km s−1 (AG354). For the continuum data, we show the primary-beam-corrected maps. The beam size and the scale bar are shown in the bottom left and bottom right corners, respectively.
Current usage metrics show cumulative count of Article Views (full-text article views including HTML views, PDF and ePub downloads, according to the available data) and Abstracts Views on Vision4Press platform.
Data correspond to usage on the plateform after 2015. The current usage metrics is available 48-96 hours after online publication and is updated daily on week days.
Initial download of the metrics may take a while.