Fig. C.1
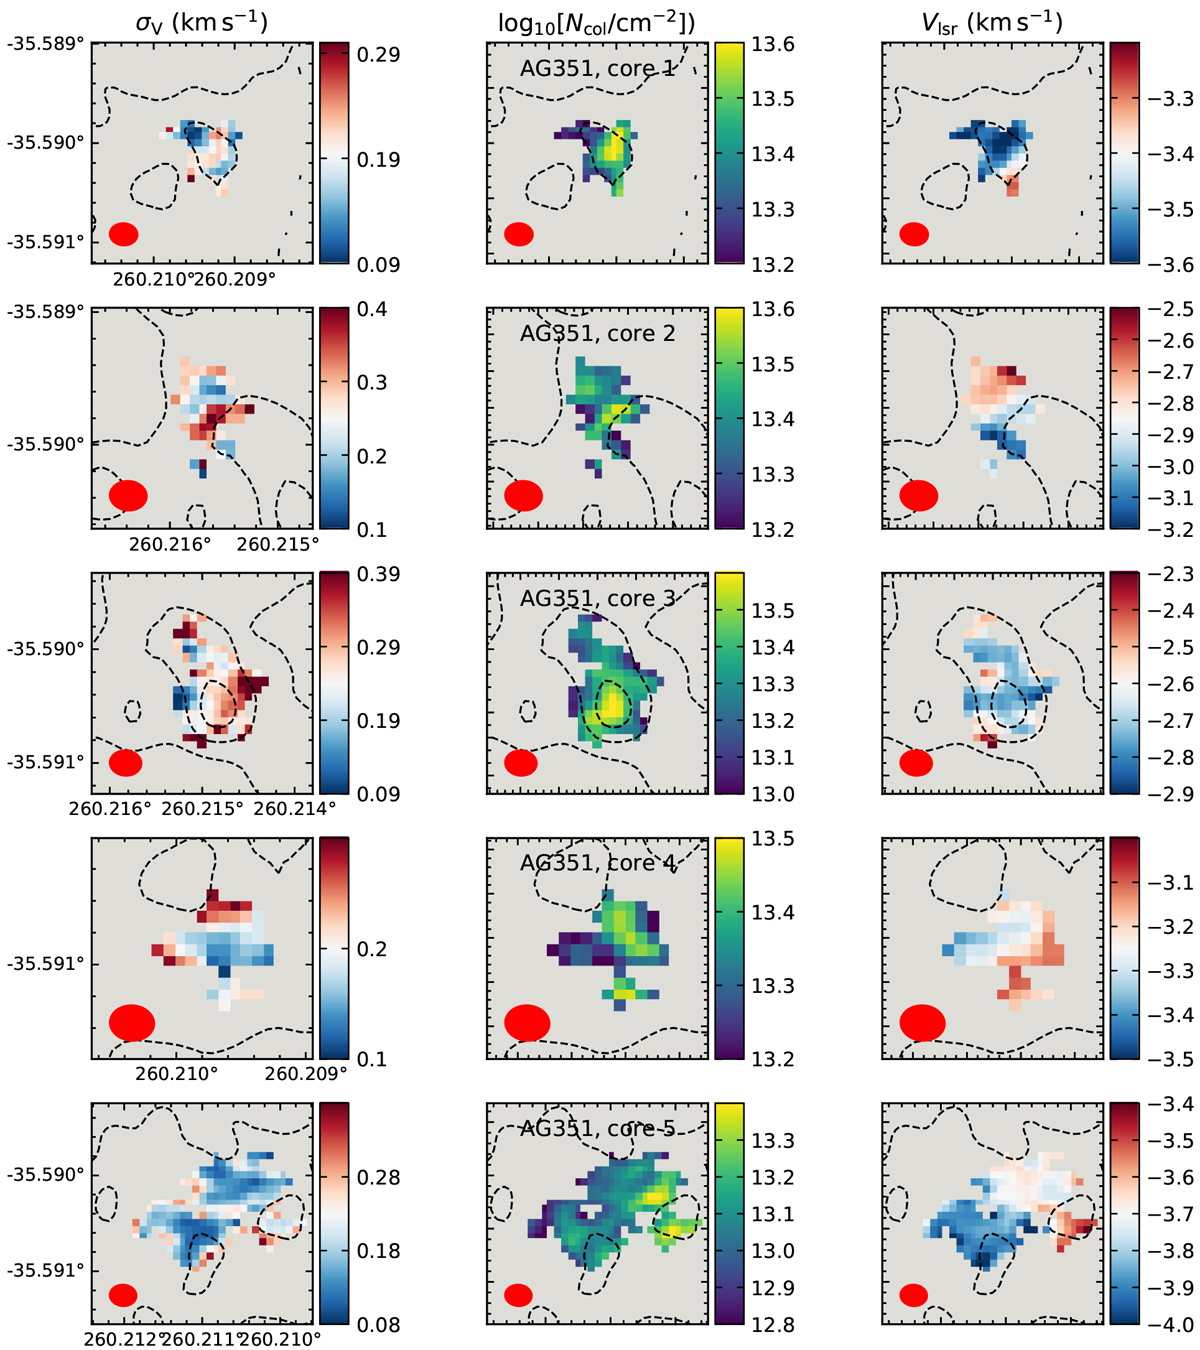
Left panels: maps of σV, in km s−1 units. Central panels: Maps of the molecular column density of o-H2D+, in unit of log10(cm−2). Right panels: maps of Vlsr, in km s−1 units. Each row shows a different core, labelled at the top of the central panel. The beam size of the H2D+ observations is shown in the bottom right corners. The coordinates are shown in the ICRS system. The dashed contours show the continuum emission at levels [1, 5, 10, 15, 20] mJy beam−1.
Current usage metrics show cumulative count of Article Views (full-text article views including HTML views, PDF and ePub downloads, according to the available data) and Abstracts Views on Vision4Press platform.
Data correspond to usage on the plateform after 2015. The current usage metrics is available 48-96 hours after online publication and is updated daily on week days.
Initial download of the metrics may take a while.