Open Access
Fig. B.1
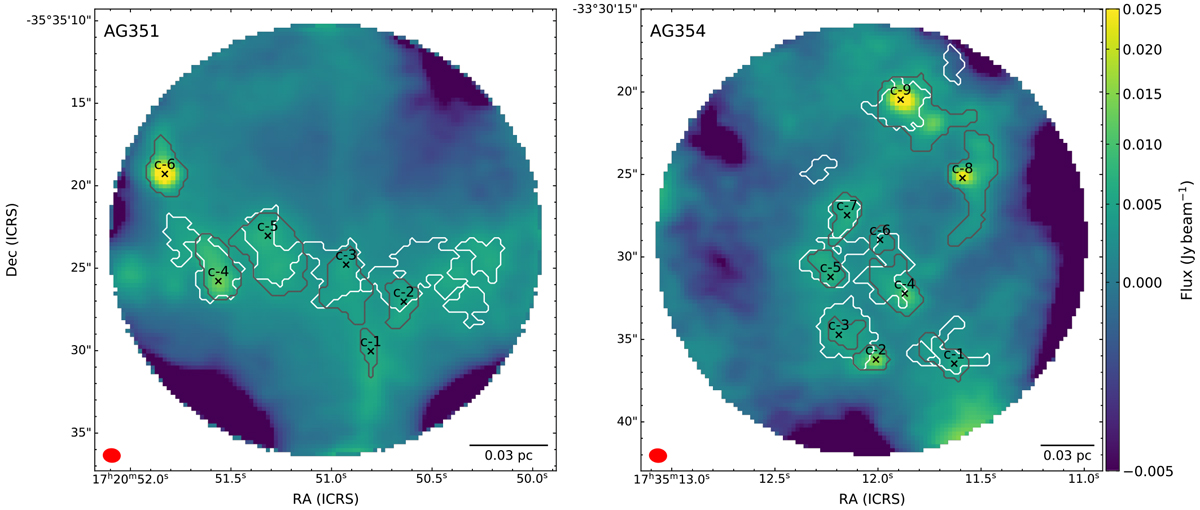
Background image shows the dust thermal emission in Band 7, with the continuum-identified structures overlaid as grey contours. The black crosses show the position of the flux peak within each core. The white contours show the H2D+ -identified cores resulting from the SCIMES analysis.
Current usage metrics show cumulative count of Article Views (full-text article views including HTML views, PDF and ePub downloads, according to the available data) and Abstracts Views on Vision4Press platform.
Data correspond to usage on the plateform after 2015. The current usage metrics is available 48-96 hours after online publication and is updated daily on week days.
Initial download of the metrics may take a while.