Fig. A.1
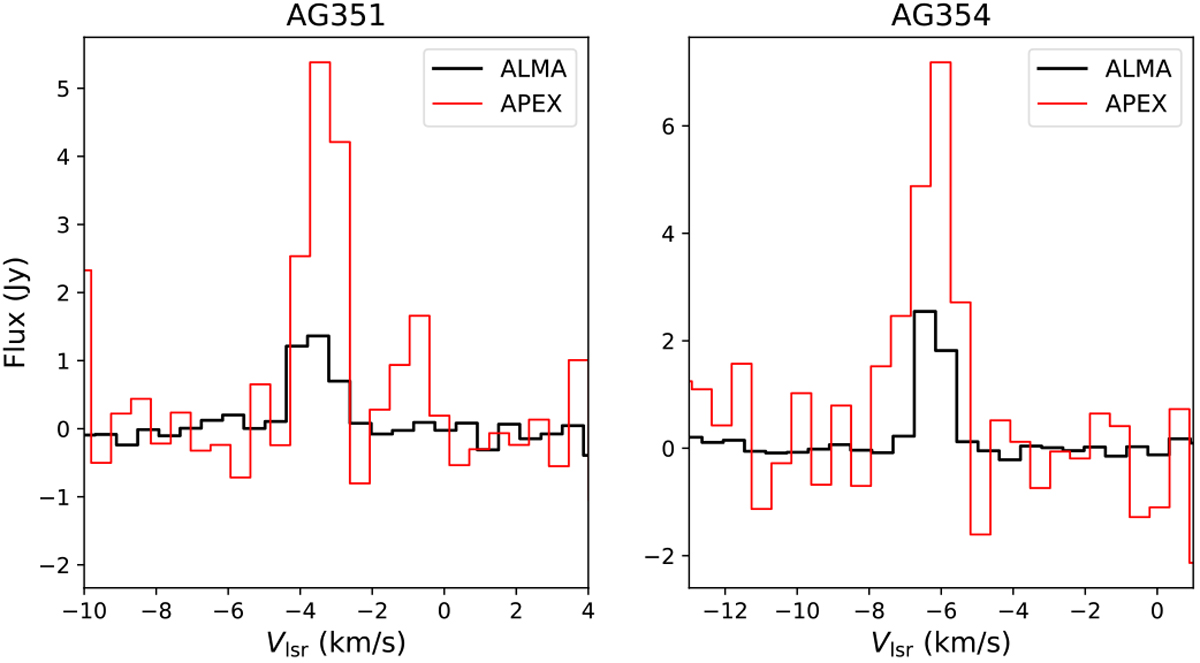
Comparison of the o-H2D+(11,0−11,1) spectra observed by APEX (red) and ALMA (black) in AG351 and AG354, from left to right. For a fair comparison, the APEX spectra from Sabatini et al. (2020) were converted in flux units using the APEX gain (40 Jy K−1). The ALMA spectra were computed integrating the signal over an area corresponding to the APEX beam size (16.8″), and they were smoothed to the APEX spectral resolution.
Current usage metrics show cumulative count of Article Views (full-text article views including HTML views, PDF and ePub downloads, according to the available data) and Abstracts Views on Vision4Press platform.
Data correspond to usage on the plateform after 2015. The current usage metrics is available 48-96 hours after online publication and is updated daily on week days.
Initial download of the metrics may take a while.