Fig. 6
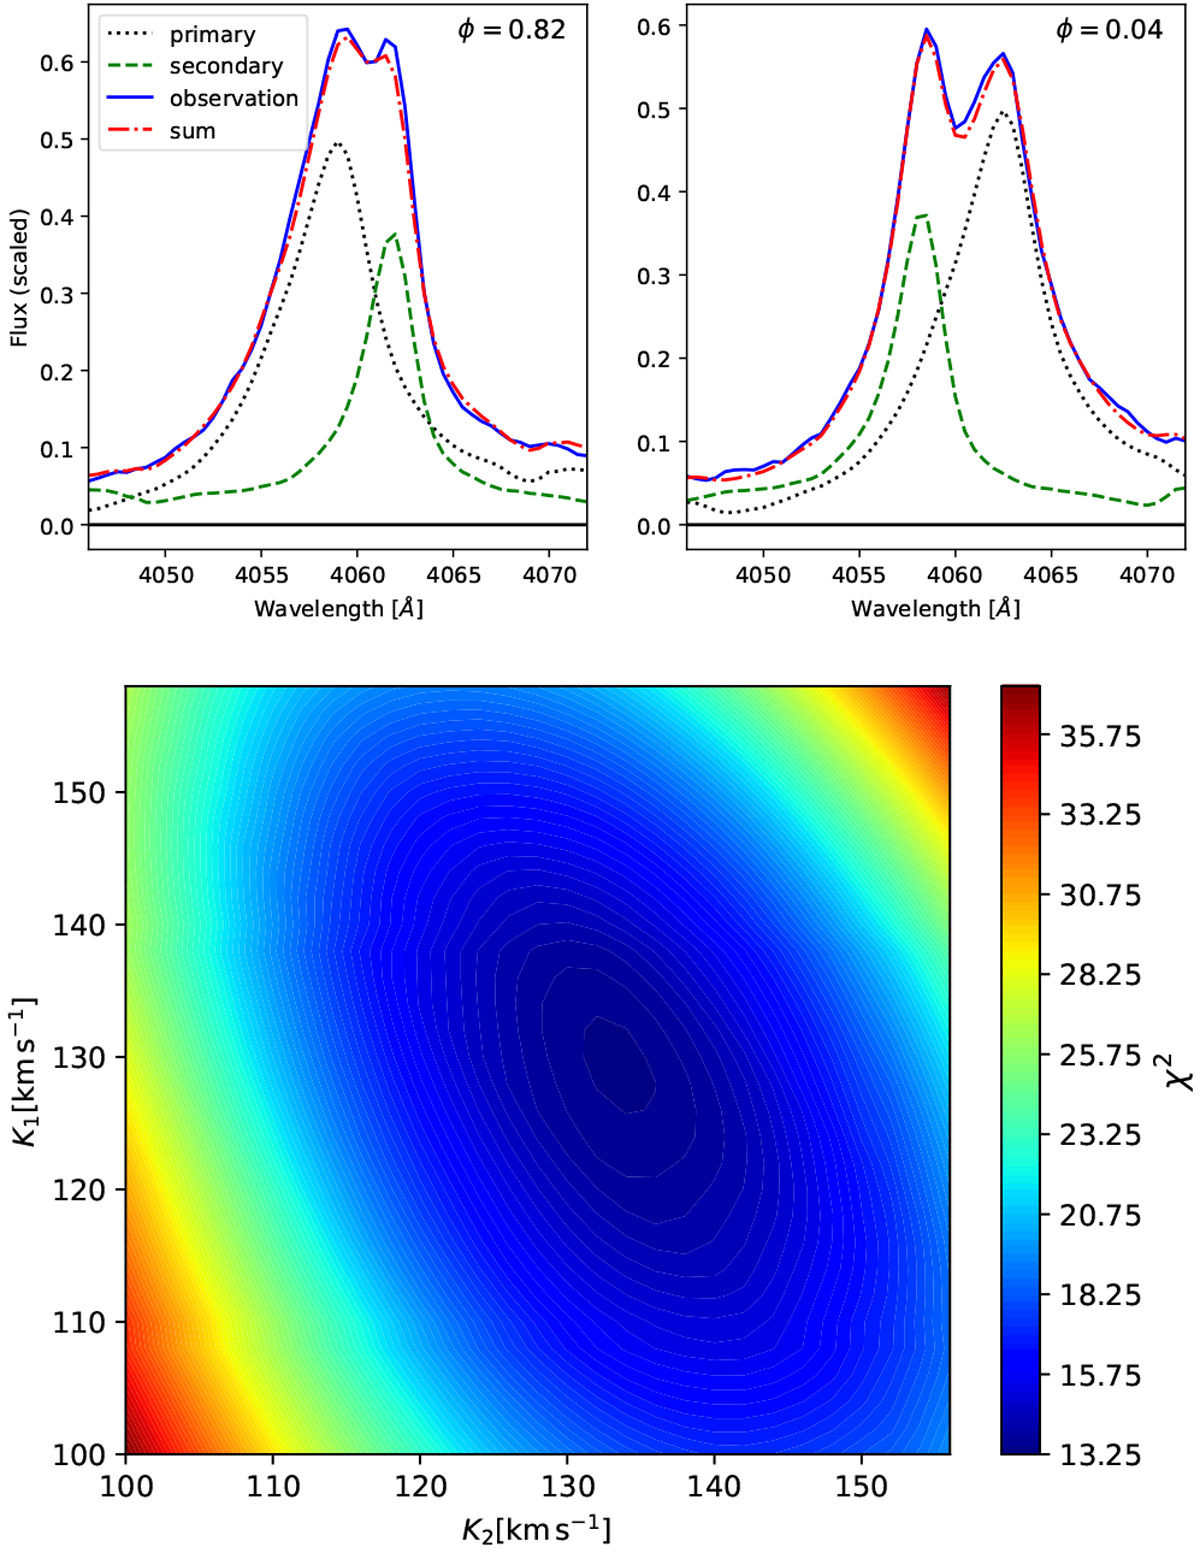
Upper panels: comparison between the disentangled spectra obtained for the best-fitting K1 and K2 values, their sum, and observations at two phases close to RV extremes for the N IV λ4058. Lower panel:reduced χ2 as a functionof K1 and K2 for the N IV λ4058 line. The analysis is performed using the X-shooter data. The minimum is at K1 = 129 ± 6 km s−1, K2 = 134 ± 4 km s−1.
Current usage metrics show cumulative count of Article Views (full-text article views including HTML views, PDF and ePub downloads, according to the available data) and Abstracts Views on Vision4Press platform.
Data correspond to usage on the plateform after 2015. The current usage metrics is available 48-96 hours after online publication and is updated daily on week days.
Initial download of the metrics may take a while.