Fig. 14
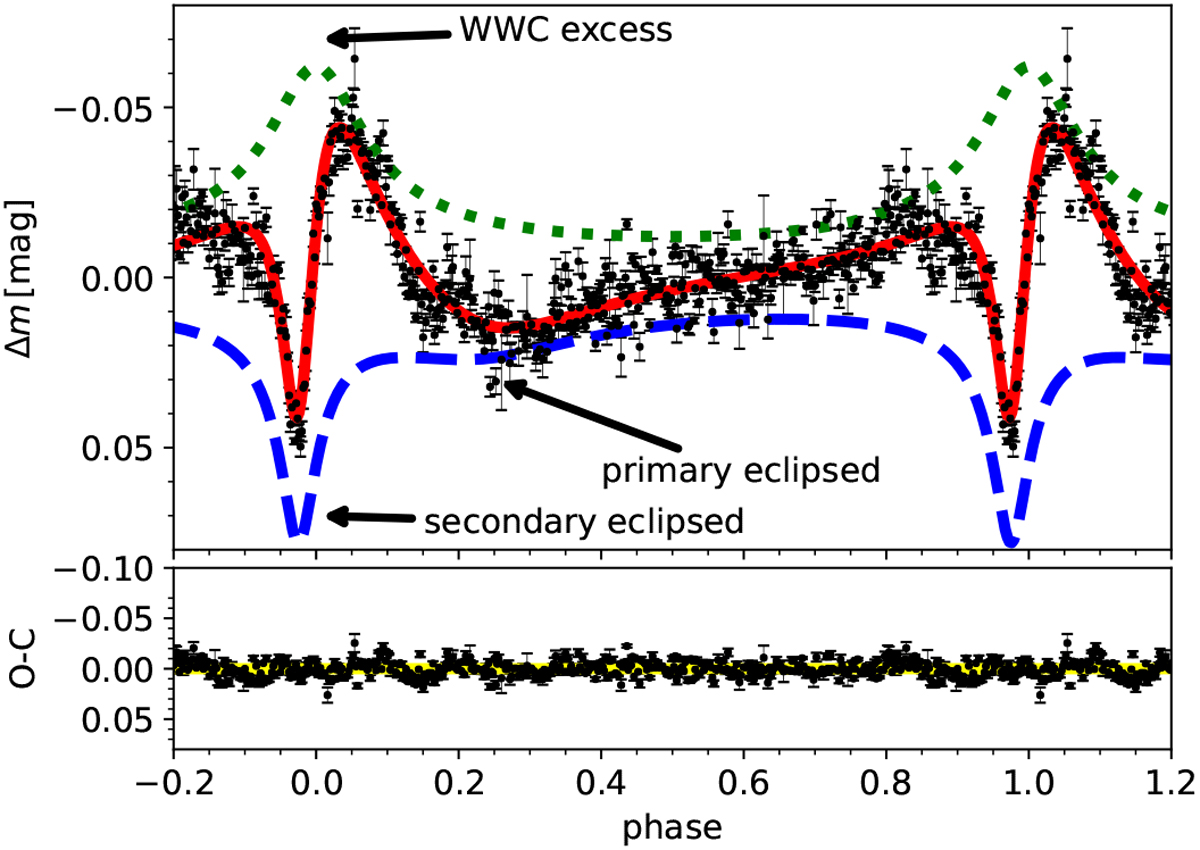
Upper panel: comparison between the observed ASAS-SN light curve and our best-fitting hybrid light-curve model (red solid line) consisting of double wind-eclipse (blue dashed line) plus WWC excess emission (green dotted line), which are multiplied by 0.5 for clarity. Lower panel: residuals between observation and model (O–C).
Current usage metrics show cumulative count of Article Views (full-text article views including HTML views, PDF and ePub downloads, according to the available data) and Abstracts Views on Vision4Press platform.
Data correspond to usage on the plateform after 2015. The current usage metrics is available 48-96 hours after online publication and is updated daily on week days.
Initial download of the metrics may take a while.