Fig. 10
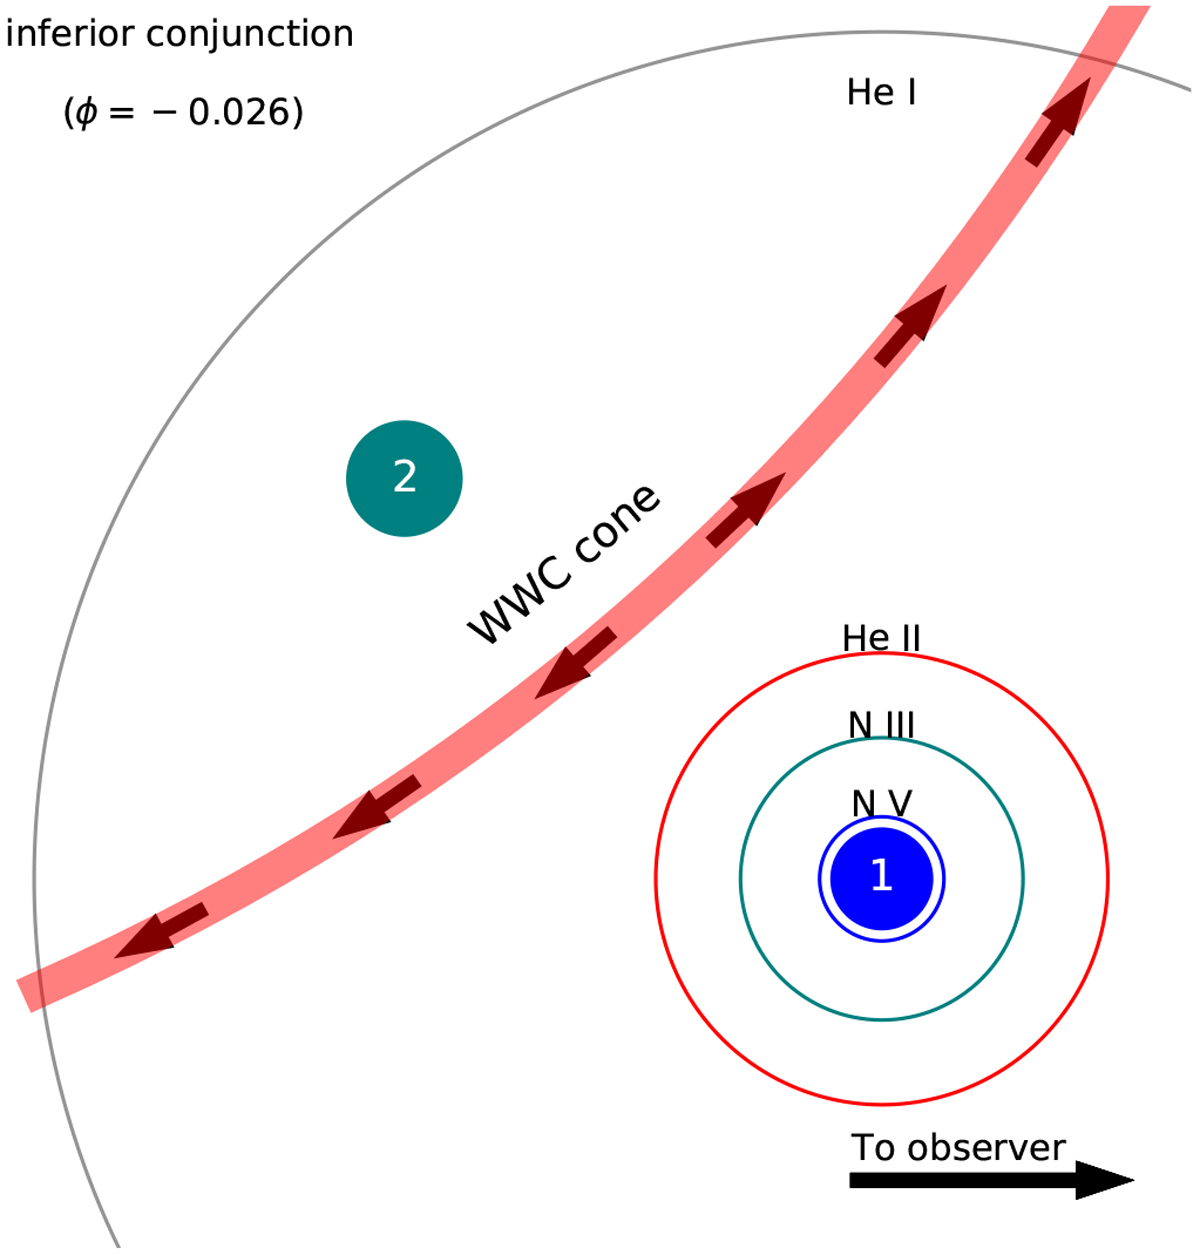
Schematic of R 144 as seen during primary inferior conjunction (ϕ ≈ −0.026). The primary (filled blue circle) and secondary (filled teal circle) are plotted to scale with their relative separation. The thick red line indicates the WWC cone. The line-forming regions of several diagnostic lines for the primary star, as calculated from our tailored model atmosphere (Sect. 3.3), are denoted. The line-forming regions of the secondary star are comparable.
Current usage metrics show cumulative count of Article Views (full-text article views including HTML views, PDF and ePub downloads, according to the available data) and Abstracts Views on Vision4Press platform.
Data correspond to usage on the plateform after 2015. The current usage metrics is available 48-96 hours after online publication and is updated daily on week days.
Initial download of the metrics may take a while.