Free Access
Fig. 8
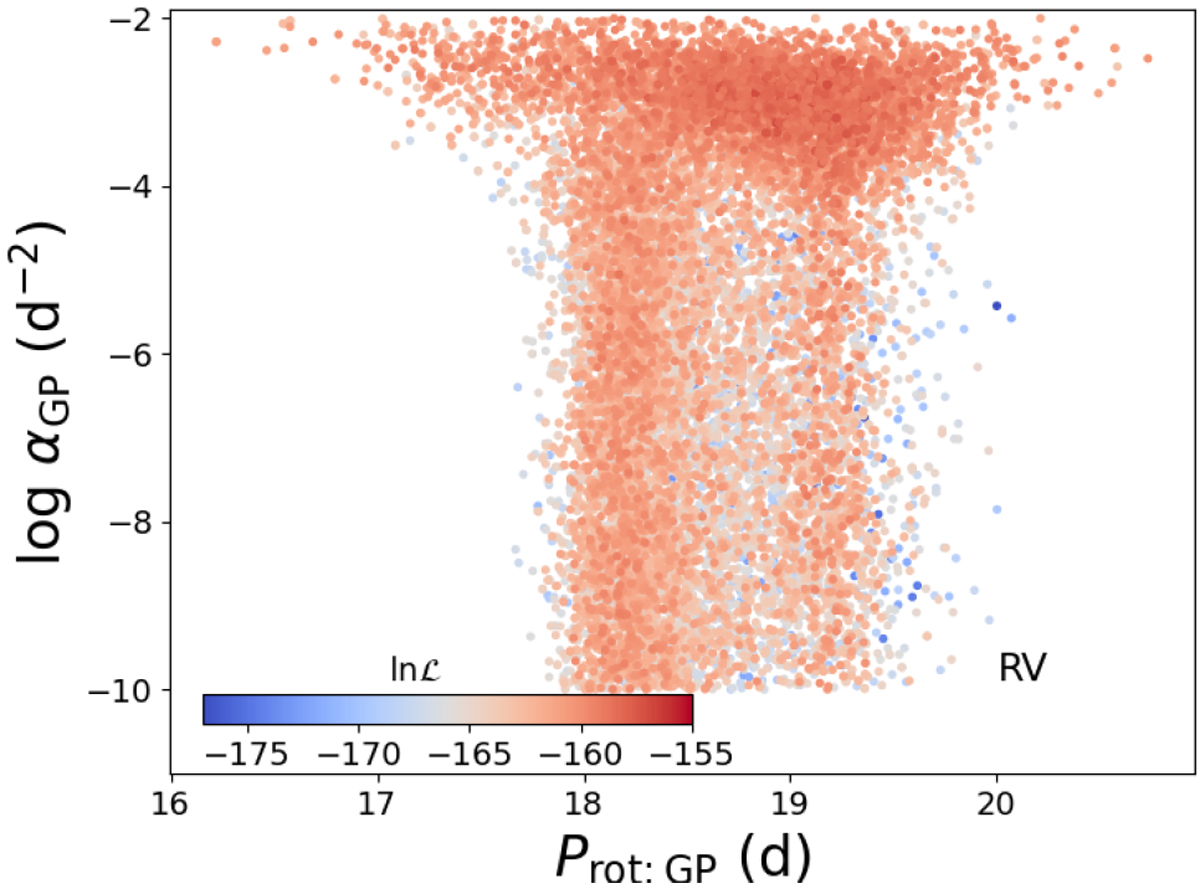
Posterior distribution of the GP fit to the RV data in the α versus Prot plane for TOI-1685. The color coding shows the log-likelihood normalized to the highest value in the posterior sample.
Current usage metrics show cumulative count of Article Views (full-text article views including HTML views, PDF and ePub downloads, according to the available data) and Abstracts Views on Vision4Press platform.
Data correspond to usage on the plateform after 2015. The current usage metrics is available 48-96 hours after online publication and is updated daily on week days.
Initial download of the metrics may take a while.