Fig. 7
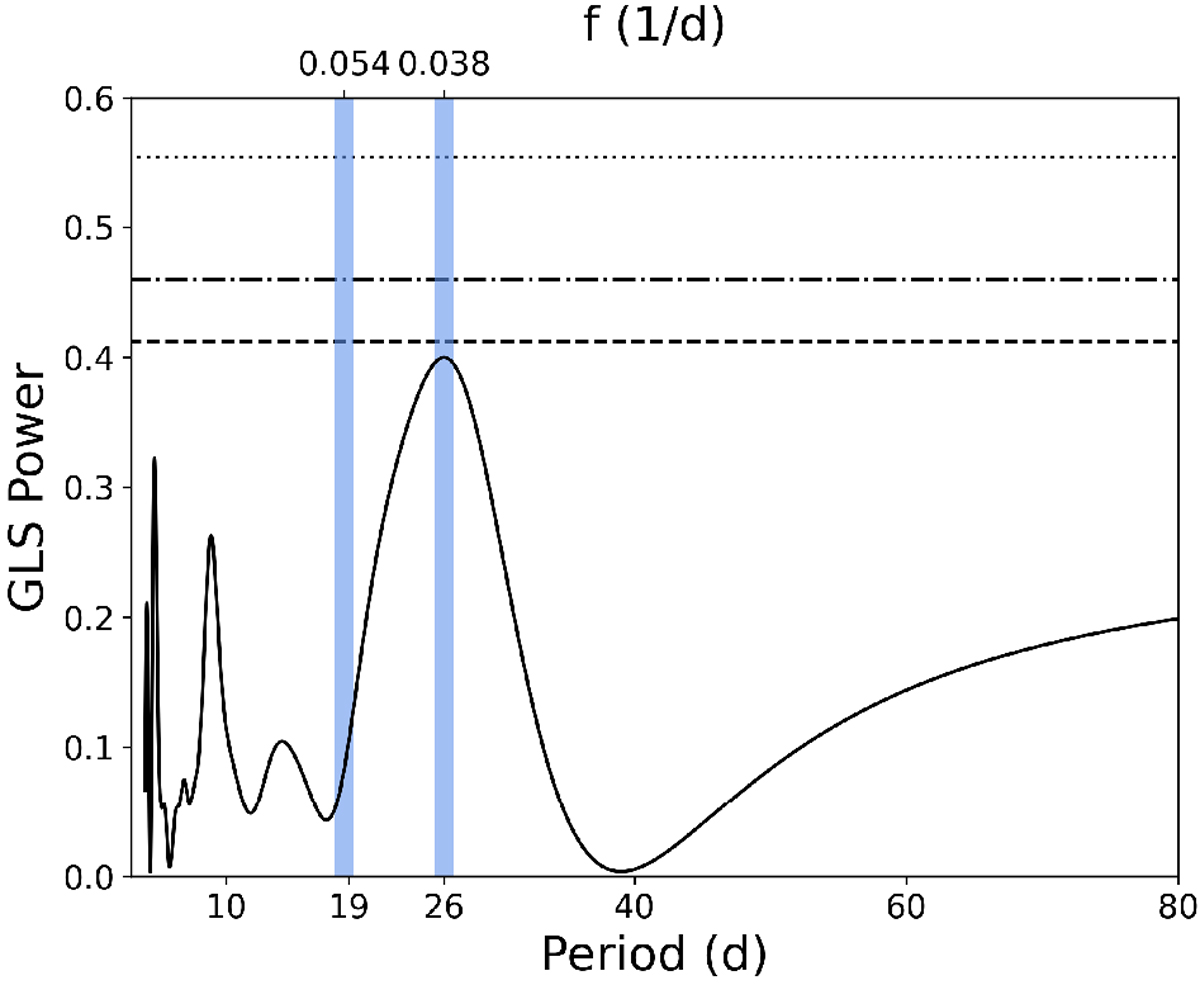
GLS periodogram of the joint V -band LCOGT Teide and Haleakal = a light curve. The horizontal lines mark the theoretical FAP levels of 1% (dotted), 5% (dash-dotted), and 10% (dashed). The highest peak, near the 10% FAP level, which is related to the rotational period and has a period of 26.0 ± 2.5 d, and the signal found in the RV data at ~19 d are marked with blue vertical bands.
Current usage metrics show cumulative count of Article Views (full-text article views including HTML views, PDF and ePub downloads, according to the available data) and Abstracts Views on Vision4Press platform.
Data correspond to usage on the plateform after 2015. The current usage metrics is available 48-96 hours after online publication and is updated daily on week days.
Initial download of the metrics may take a while.