Fig. 8
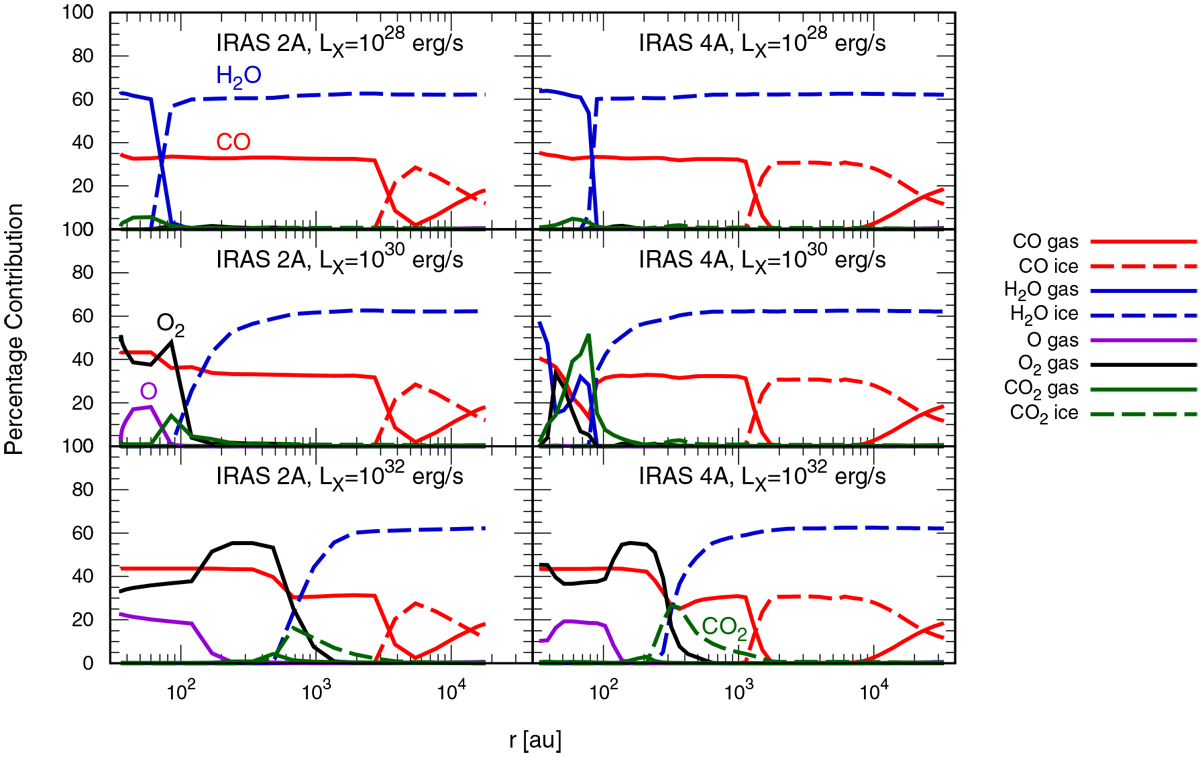
Radial profiles of percentage contributions of the dominant oxygen-bearing molecules to the total elemental oxygen abundance (=3.2 × 10⁻⁴) in the NGC 1333-IRAS 2A envelope model (left panels) and the NGC 1333-IRAS 4A envelope model (right panels). The top, middle, and bottom panels show the radial profiles with LX = 1028, 1030, and 1032 erg s−1, respectively. The red, blue, purple, black, and green line profiles respectively show the contribution of CO, H2O, O, O2, and CO2 molecules. The solid and dashed line profiles show the contribution of gaseous and icy molecules. Since O2 and CO2 include two oxygen atoms per molecule, the percentage contributions are twice as high as those of CO, H2O, and O whenthey have same fractional abundances with respect to hydrogen nuclei.
Current usage metrics show cumulative count of Article Views (full-text article views including HTML views, PDF and ePub downloads, according to the available data) and Abstracts Views on Vision4Press platform.
Data correspond to usage on the plateform after 2015. The current usage metrics is available 48-96 hours after online publication and is updated daily on week days.
Initial download of the metrics may take a while.