Fig. 3
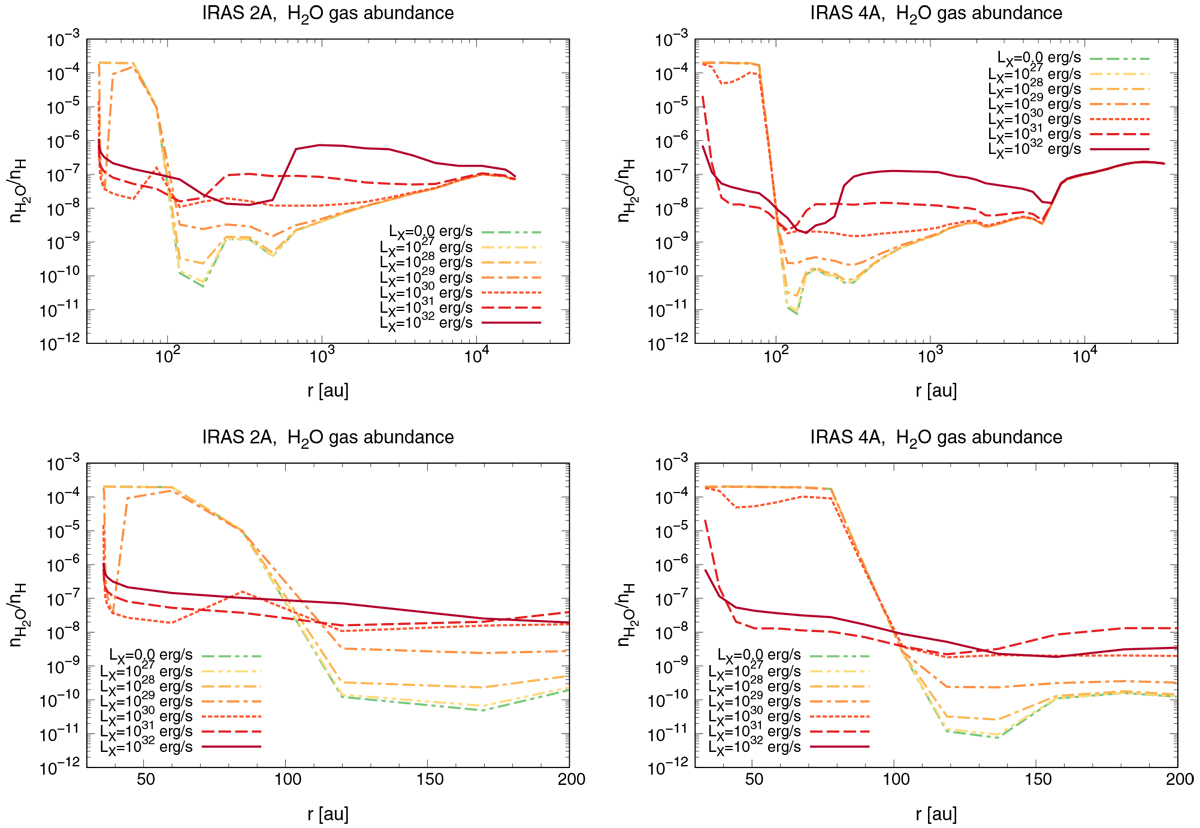
Radial profiles of water gas fractional abundances with respect to total hydrogen nuclei densities
![]() /nH
for the whole envelopes on a log scale (top panels) and the inner regions only (r < 200 au) on a linear scale (bottom panels) in NGC 1333-IRAS 2A (left) and NGC 1333-IRAS 4A (right) envelope models. The double-dashed double-dotted lines, the dashed double-dotted lines, the double-dashed dotted lines, the dash-dotted lines, the dotted lines, the dashed lines, and the solid lines show the radial
/nH
for the whole envelopes on a log scale (top panels) and the inner regions only (r < 200 au) on a linear scale (bottom panels) in NGC 1333-IRAS 2A (left) and NGC 1333-IRAS 4A (right) envelope models. The double-dashed double-dotted lines, the dashed double-dotted lines, the double-dashed dotted lines, the dash-dotted lines, the dotted lines, the dashed lines, and the solid lines show the radial
![]() /nH
profiles for values of central star X-ray luminosities LX = 0,
1027, 1028, 1029, 1030, 1031, and 1032 erg s−1, respectively. The line color gradually changes from green to yellow, orange, red, and brown as the value of
LX increases. In Figs. 5–7, C.1, C.2, D.1, E.1, H.1, and H.2, we adopt the same line types and color patterns of the calculated radial fractional abundance profiles of gas-phase molecules for different values of
LX.
/nH
profiles for values of central star X-ray luminosities LX = 0,
1027, 1028, 1029, 1030, 1031, and 1032 erg s−1, respectively. The line color gradually changes from green to yellow, orange, red, and brown as the value of
LX increases. In Figs. 5–7, C.1, C.2, D.1, E.1, H.1, and H.2, we adopt the same line types and color patterns of the calculated radial fractional abundance profiles of gas-phase molecules for different values of
LX.
Current usage metrics show cumulative count of Article Views (full-text article views including HTML views, PDF and ePub downloads, according to the available data) and Abstracts Views on Vision4Press platform.
Data correspond to usage on the plateform after 2015. The current usage metrics is available 48-96 hours after online publication and is updated daily on week days.
Initial download of the metrics may take a while.