Fig. 2
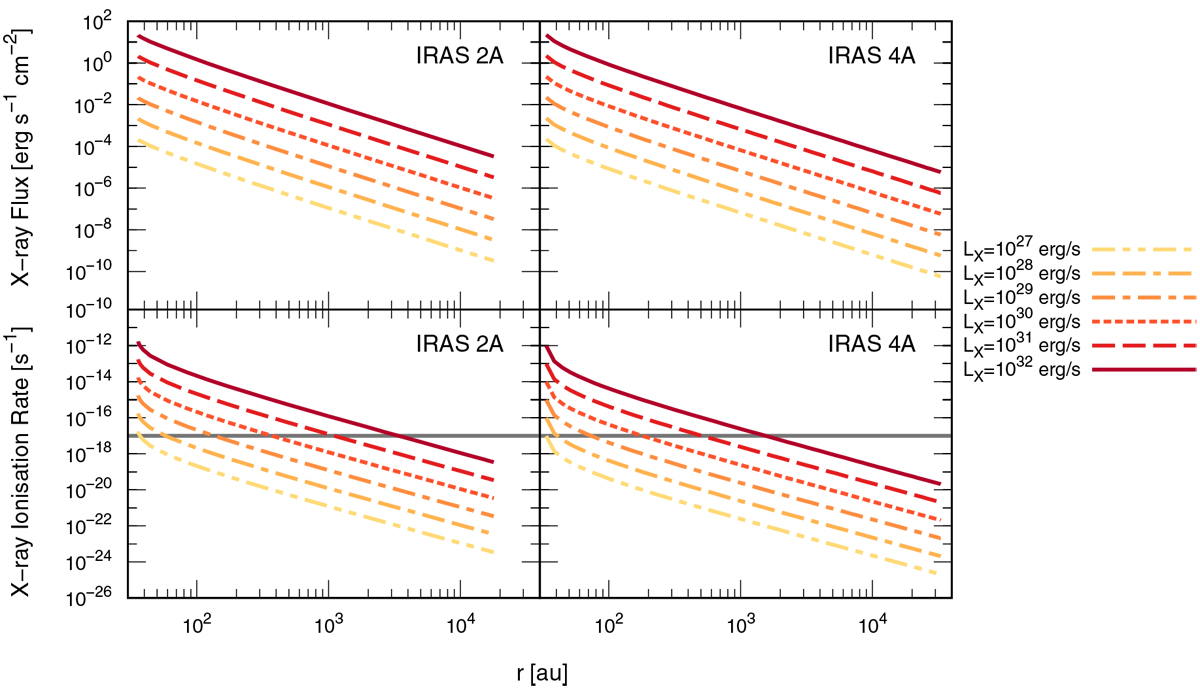
Radial profiles of the X-ray flux FX(r) (erg s−1 cm−2) (top panels) and the secondary X-ray ionization rate ξX(r) (s−1) (bottom panels) in NGC 1333-IRAS 2A (left) and NGC 1333-IRAS 4A (right) envelope models. In the bottom panels, the horizontal gray solid lines show the assumed constant cosmic-ray ionization rate ξCR (r) = 1.0 × 10⁻¹⁷ s−1. In all panels the different line styles and colors in the radial FX(r) and ξX (r) profiles denote models with different central star X-ray luminosities LX.
Current usage metrics show cumulative count of Article Views (full-text article views including HTML views, PDF and ePub downloads, according to the available data) and Abstracts Views on Vision4Press platform.
Data correspond to usage on the plateform after 2015. The current usage metrics is available 48-96 hours after online publication and is updated daily on week days.
Initial download of the metrics may take a while.