Fig. 12
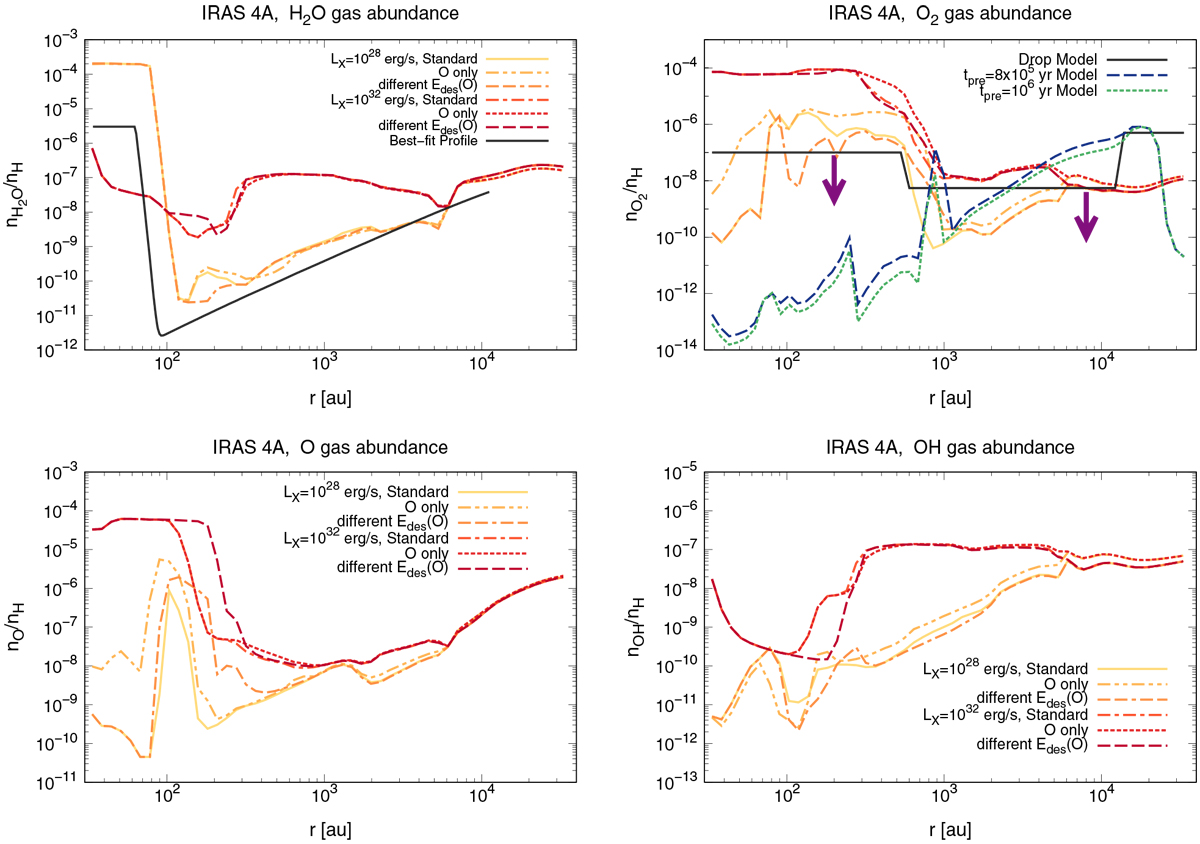
Radial profiles of gaseous fractional abundances of H2O, O2, O, and OH in NGC 1333-IRAS 4A envelope models. The yellow solid lines and scarlet dash-dotted lines show the radial profiles of our standard model calculations for values of central star X-ray luminosities LX = 1028 and 1032 erg s−1, respectively (see also Figs. 3, 5, and 6). The orange dashed double-dotted lines and red dotted lines show those of our test calculations assuming that the product of H2O photodissociation is 100% atomic oxygen, unlike our standard model (100% OH) (see also Fig. H.1). The orange double-dashed dotted lines and brown dashed lines show those of our test calculations assuming the smaller Edes (j) for atomic oxygen (=800 K) than that in our fiducial model (=1660 K) (see also Fig. H.2). In the top left panel, the observational best-fit H2O gas abundance profile obtained in van Dishoeck et al. (2021) is overplotted with the black solid line (see also Fig. 10). In the top right panel the three model O2 gas abundance profiles obtained in Yıldız et al. (2013) are overplotted (see also Fig. 10).
Current usage metrics show cumulative count of Article Views (full-text article views including HTML views, PDF and ePub downloads, according to the available data) and Abstracts Views on Vision4Press platform.
Data correspond to usage on the plateform after 2015. The current usage metrics is available 48-96 hours after online publication and is updated daily on week days.
Initial download of the metrics may take a while.