Fig. 11
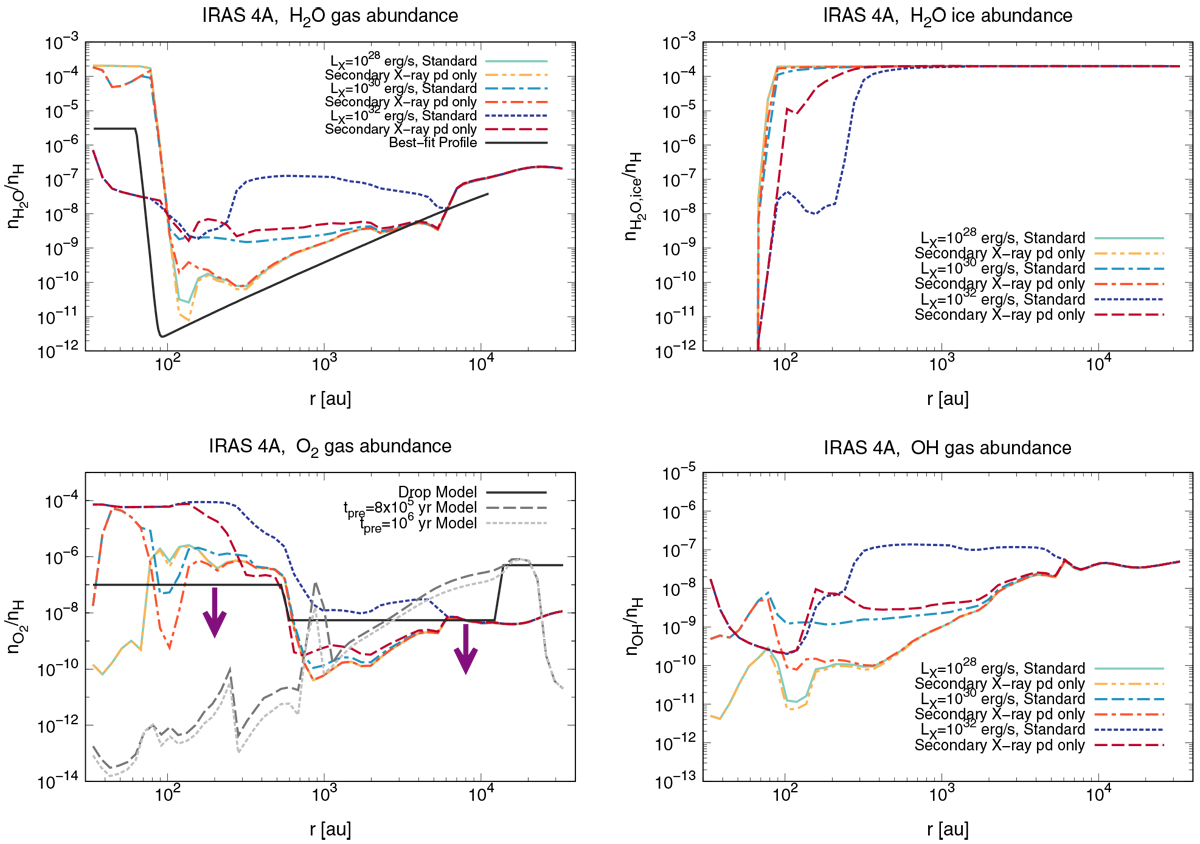
Radial profiles of gaseous fractional abundances of H2O, O2, and OH, andicy fractional abundances of H2O in the NGC 1333-IRAS 4A envelope models. The light green solid lines, the cyan double-dashed dotted lines, and the blue dotted lines show the radial profiles of our standard model calculations, for values of central star X-ray luminosities LX =1028, 1030, and 1032 erg s−1, respectively (see also Figs. 3, 4, 5, 6). The yellow dashed double-dotted lines, the scarlet dashed dotted lines, and the brown dashed lines show the radial profiles of our additional model calculations for LX = 1028, 1030, and 1032 erg s−1, respectively. In the additional model calculations, we include the photodesorption by UV photons generated internally via the interaction of secondary electrons produced by X-rays with H2 molecules (the secondary (indirect) X-ray-induced photodesorption, see Figs. G.1and G.2), and we also switch off the direct X-ray-induced photodesorption (see also Fig. G.3). In the top left panel, the observational best-fit H2O gas abundance profile obtained in van Dishoeck et al. (2021) is overplotted with the black solid line (see also Fig. 10). In the bottom left panel, the three model O2 gas abundance profiles obtained in Yıldız et al. (2013) are overplotted (see also Fig. 10).
Current usage metrics show cumulative count of Article Views (full-text article views including HTML views, PDF and ePub downloads, according to the available data) and Abstracts Views on Vision4Press platform.
Data correspond to usage on the plateform after 2015. The current usage metrics is available 48-96 hours after online publication and is updated daily on week days.
Initial download of the metrics may take a while.