Fig. 10
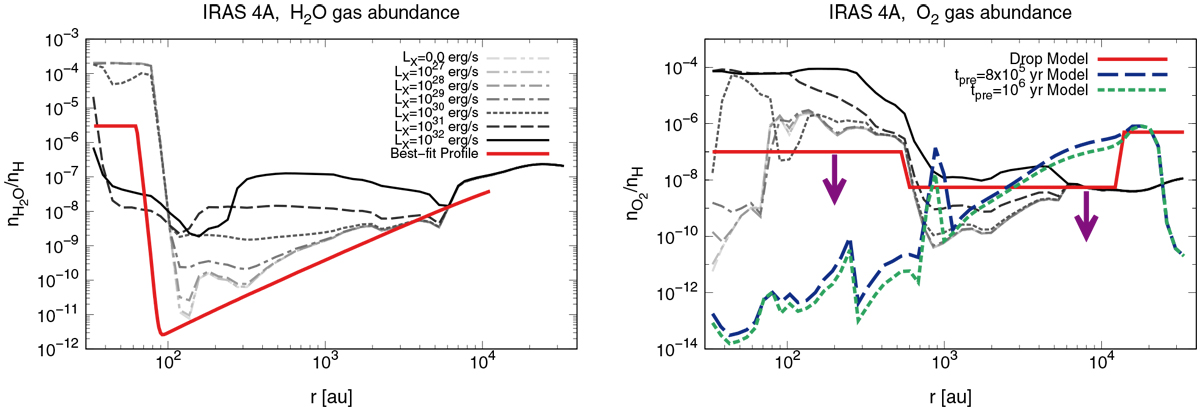
Comparison of our model and observation-based radial profiles for H2O and O2 gas fractional abundances in the IRAS 4A envelopes. Left panel: gray-scale plots (from white to black) are the radial profiles of water gas fractional abundances
![]() /nH
in the NGC 1333-IRAS 4A envelope model, which are the same as the color plots in the top right panel of Fig. 3. The red solid line shows the observational best-fit
/nH
in the NGC 1333-IRAS 4A envelope model, which are the same as the color plots in the top right panel of Fig. 3. The red solid line shows the observational best-fit
![]() /nH
profile in the IRAS 4A envelope, obtained from van Dishoeck et al. (2021). This profile is based on analysis of
Herschel/HIFI spectra which mainly trace the cold outer part (Mottram et al. 2013; Schmalzl et al. 2014), with the modification of the inner (Tgas > 100 K) water gasabundance from >10−4
to 3 × 10⁻⁶
(Persson et al. 2016). Right panel: Gray-scale plots (from white to black) are the radial profiles of molecular oxygen gas fractional abundances
/nH
profile in the IRAS 4A envelope, obtained from van Dishoeck et al. (2021). This profile is based on analysis of
Herschel/HIFI spectra which mainly trace the cold outer part (Mottram et al. 2013; Schmalzl et al. 2014), with the modification of the inner (Tgas > 100 K) water gasabundance from >10−4
to 3 × 10⁻⁶
(Persson et al. 2016). Right panel: Gray-scale plots (from white to black) are the radial profiles of molecular oxygen gas fractional abundances ![]() /nH
in the NGC 1333-IRAS 4A envelope model, which are the same as the color plots in the top right panel of Fig. 5. The model abundance profiles obtained in Yıldız et al. (2013) are over-plotted. The red solid line shows the drop gaseous O2 abundance profile by using the C18O modeling (Yıldız et al. 2012) and assuming O2
follows the same freeze-out and sublimation processes as C18O. The blue dashed and the green dotted lines show the gaseous O2
abundance profiles via their gas-grain modeling with tpre = 8 × 10⁵ yr and tpre = 106 yr, respectively. The purple arrows are to indicate that Yıldız et al. (2013) only obtained the upper limit O2 gas abundance for this object.
/nH
in the NGC 1333-IRAS 4A envelope model, which are the same as the color plots in the top right panel of Fig. 5. The model abundance profiles obtained in Yıldız et al. (2013) are over-plotted. The red solid line shows the drop gaseous O2 abundance profile by using the C18O modeling (Yıldız et al. 2012) and assuming O2
follows the same freeze-out and sublimation processes as C18O. The blue dashed and the green dotted lines show the gaseous O2
abundance profiles via their gas-grain modeling with tpre = 8 × 10⁵ yr and tpre = 106 yr, respectively. The purple arrows are to indicate that Yıldız et al. (2013) only obtained the upper limit O2 gas abundance for this object.
Current usage metrics show cumulative count of Article Views (full-text article views including HTML views, PDF and ePub downloads, according to the available data) and Abstracts Views on Vision4Press platform.
Data correspond to usage on the plateform after 2015. The current usage metrics is available 48-96 hours after online publication and is updated daily on week days.
Initial download of the metrics may take a while.