Free Access
Fig. 9
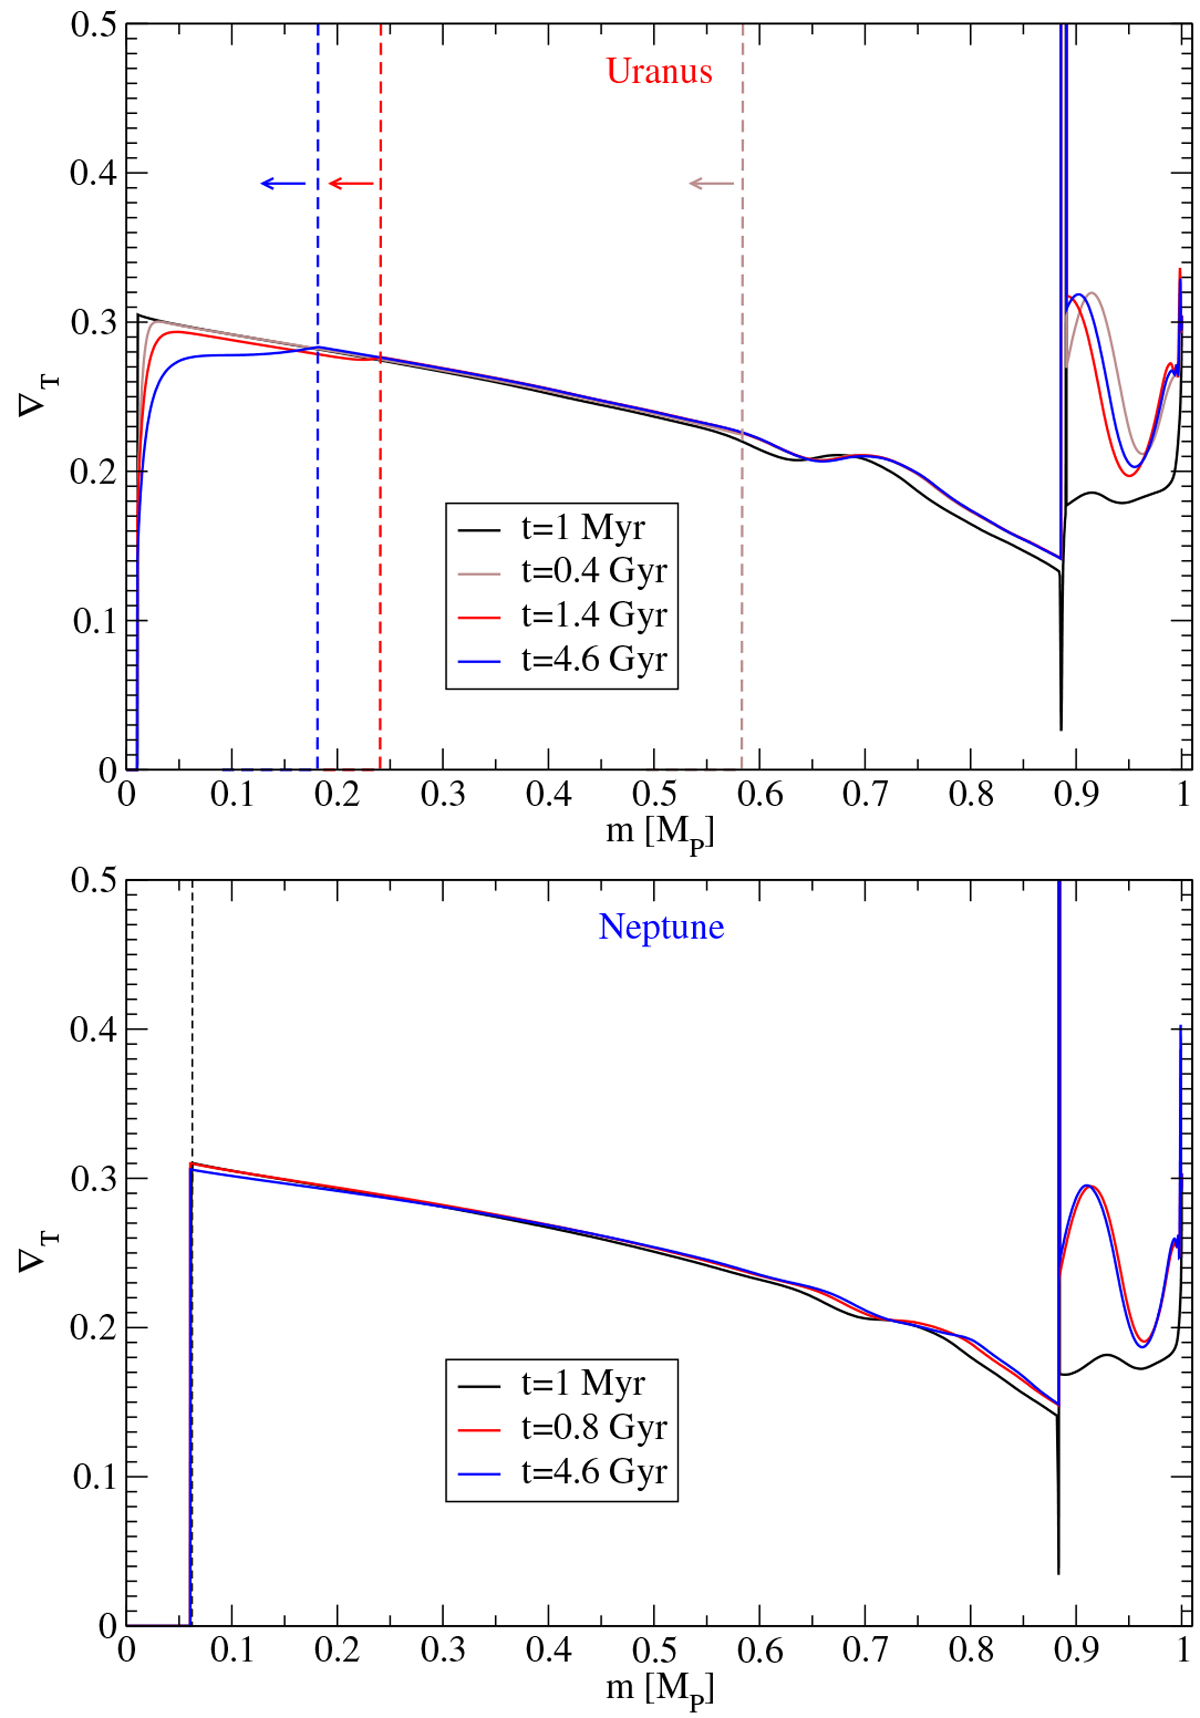
Temperature gradient profiles for the same Uranus (a) and Neptune (b)models as in Fig. 8. The value at the outside of the conductive interface is higher than the maximum displayed ∇T value by several orders of magnitude (cf. Fig. 11). The vertical dashed lines mark the upper end of the conductive zone in the deep interior.
Current usage metrics show cumulative count of Article Views (full-text article views including HTML views, PDF and ePub downloads, according to the available data) and Abstracts Views on Vision4Press platform.
Data correspond to usage on the plateform after 2015. The current usage metrics is available 48-96 hours after online publication and is updated daily on week days.
Initial download of the metrics may take a while.