Fig. 11
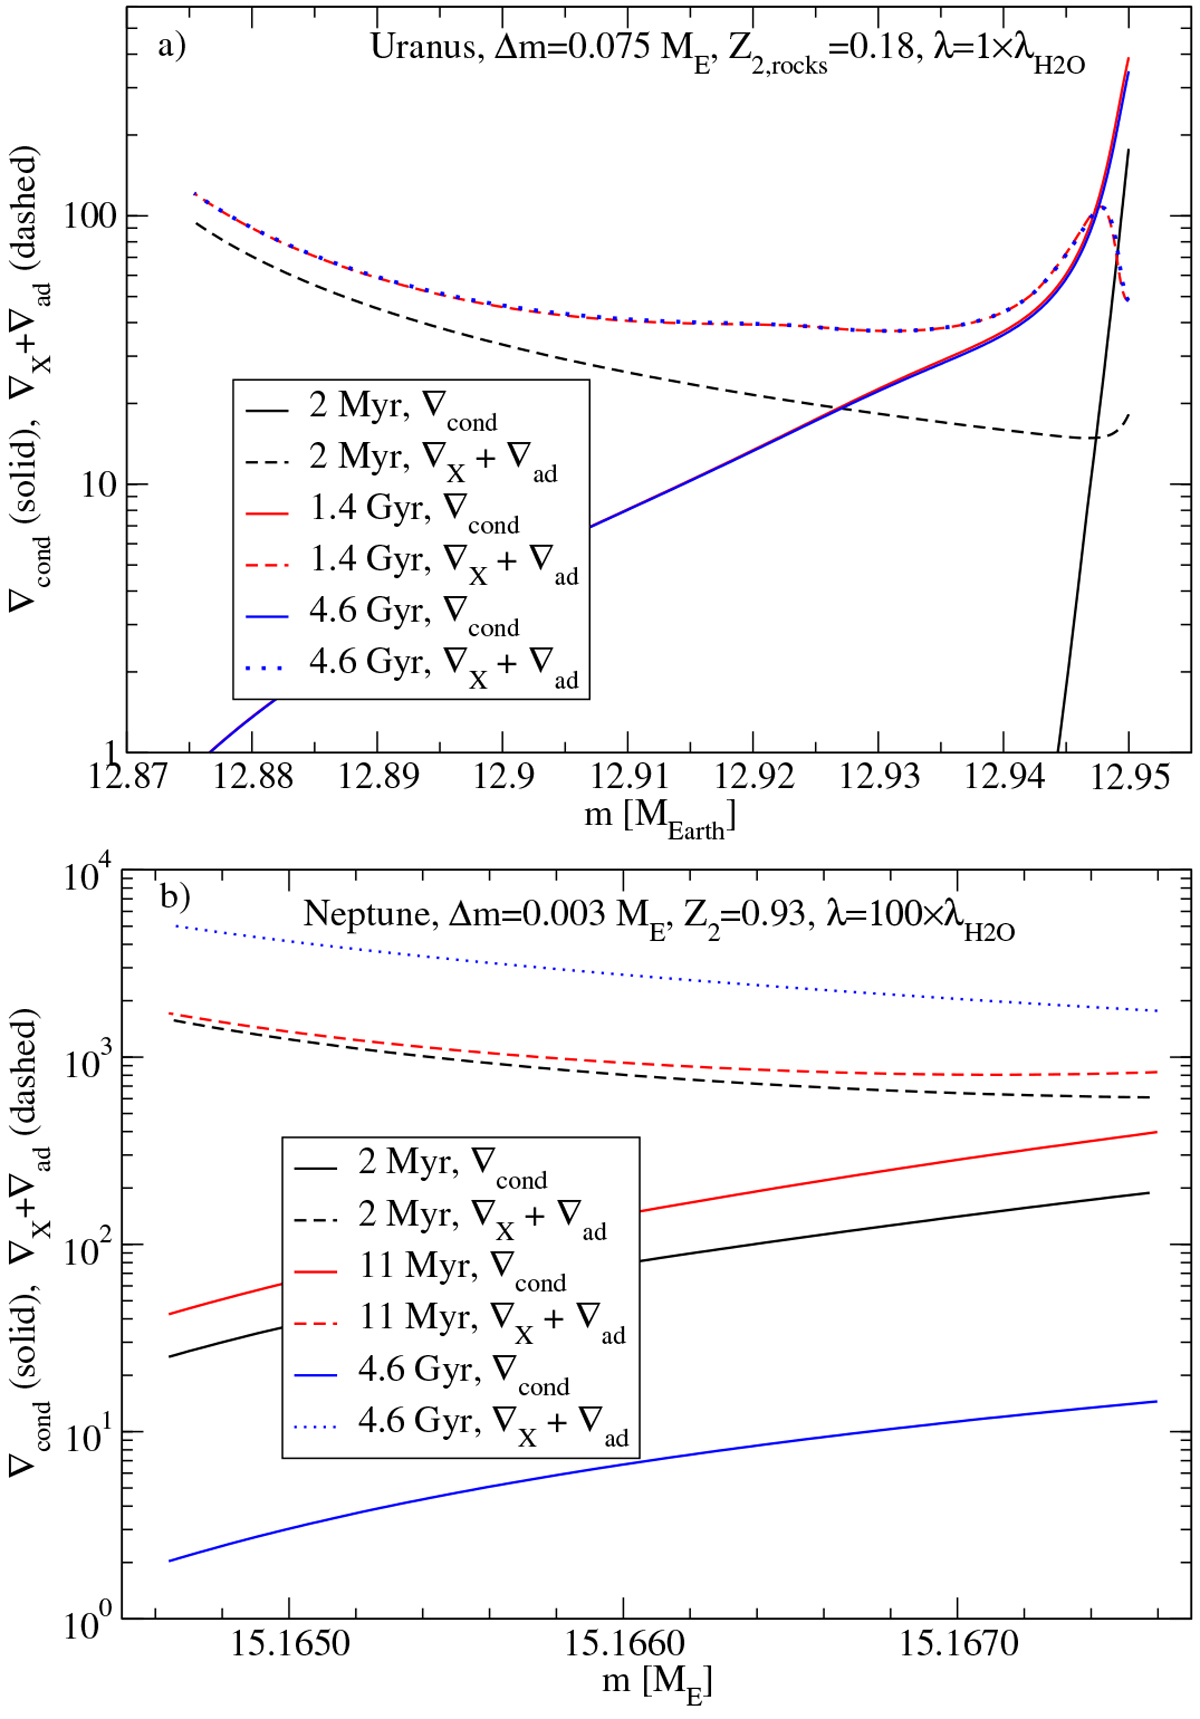
Gradients in Eq. (6) across the TBL for a Uranus model with Δm = 0.075 ME,
![]() (top panel) and a Neptune model with Δm = 0.003 ME,
(top panel) and a Neptune model with Δm = 0.003 ME,
![]() (bottom panel). Chosen times are the second time step, the time of maximum ΔT across the TBL, and the present time, respectively. Regions where ∇cond exceeds ∇X + ∇ad would be unstable to convection.
(bottom panel). Chosen times are the second time step, the time of maximum ΔT across the TBL, and the present time, respectively. Regions where ∇cond exceeds ∇X + ∇ad would be unstable to convection.
Current usage metrics show cumulative count of Article Views (full-text article views including HTML views, PDF and ePub downloads, according to the available data) and Abstracts Views on Vision4Press platform.
Data correspond to usage on the plateform after 2015. The current usage metrics is available 48-96 hours after online publication and is updated daily on week days.
Initial download of the metrics may take a while.