Fig. A.1.
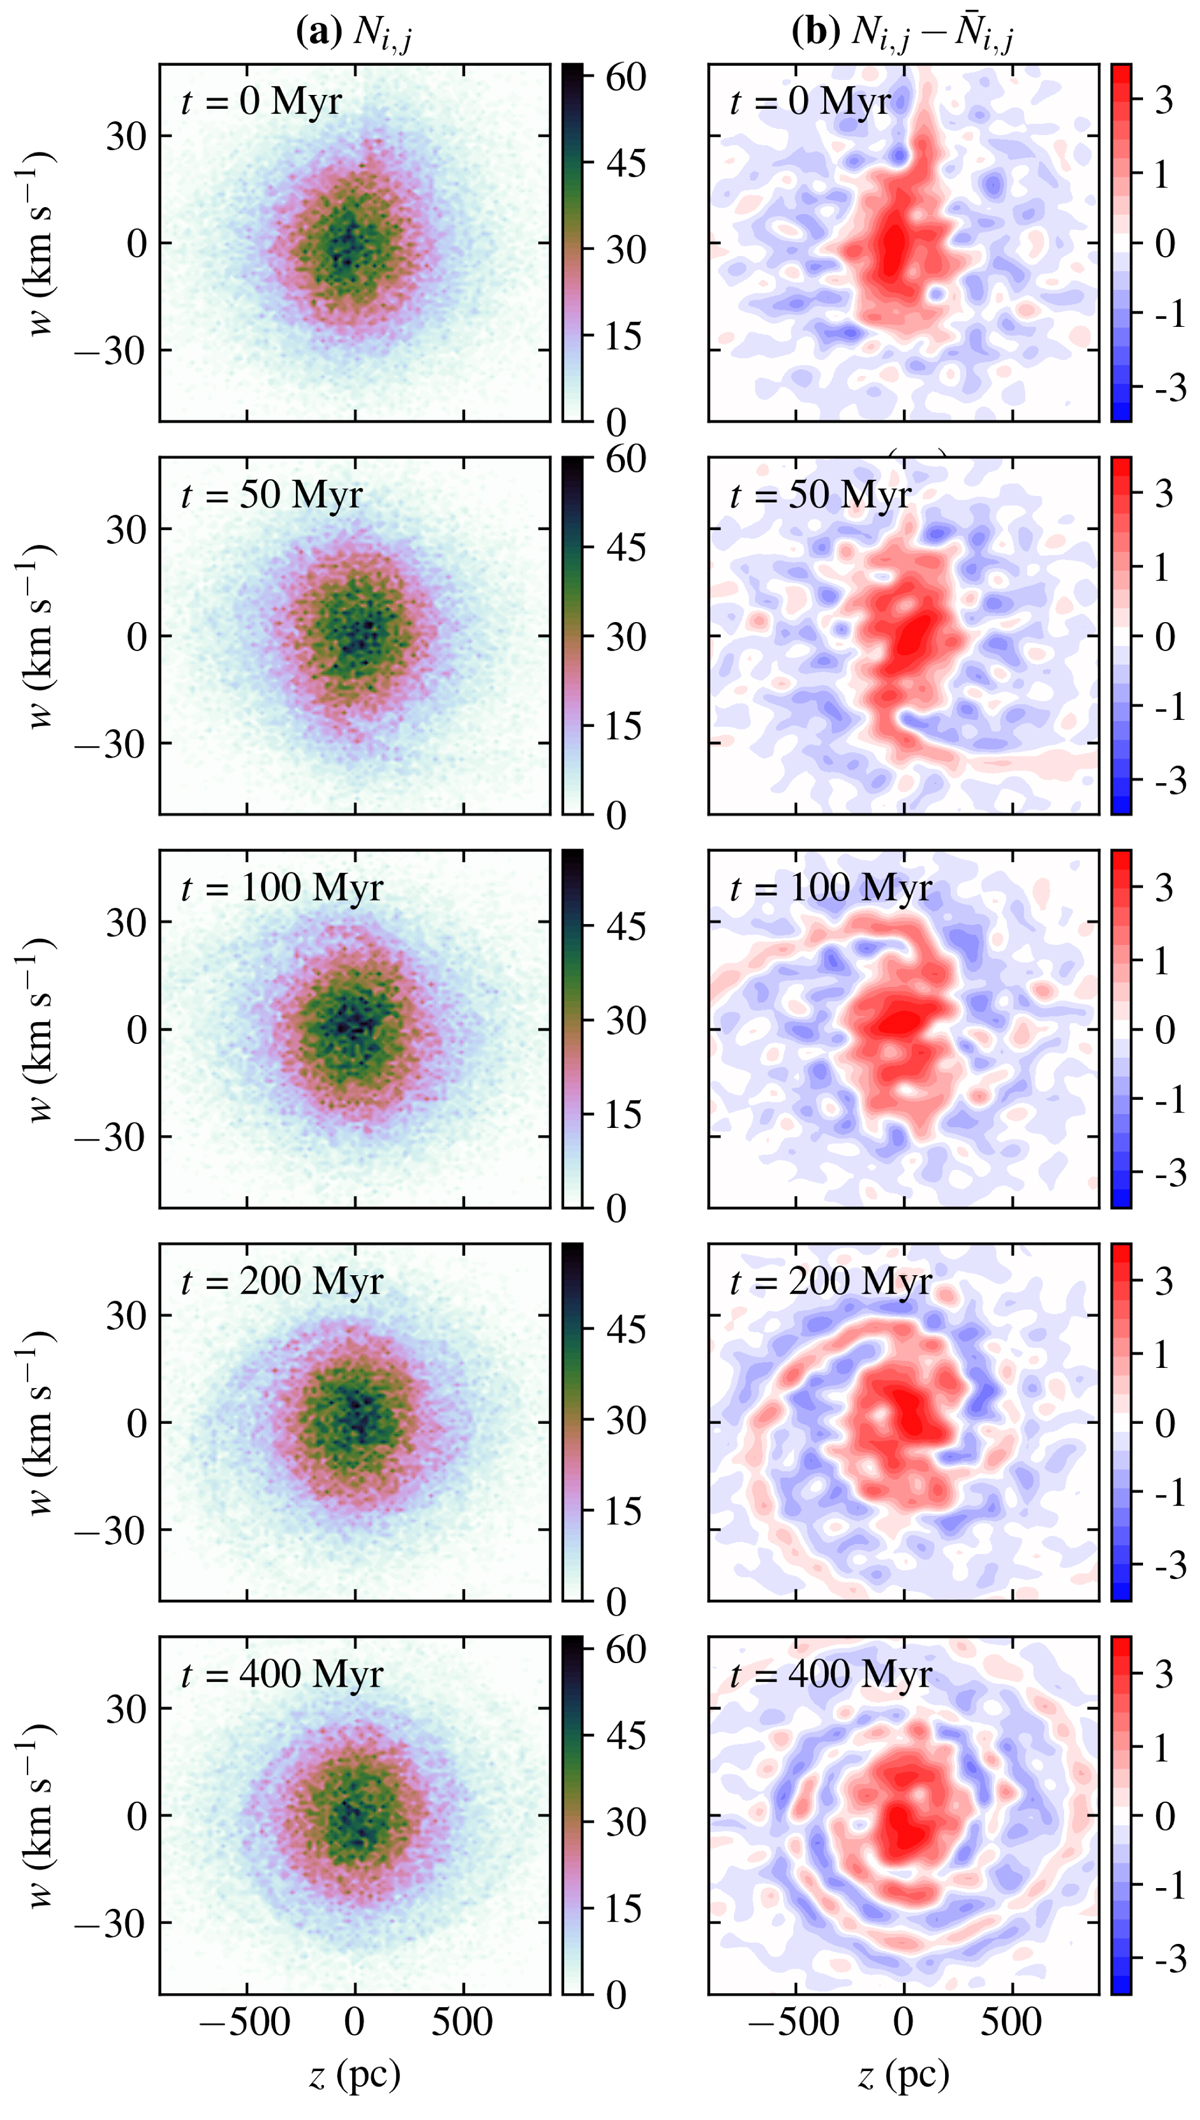
Stellar number density distribution in the (z, w)-plane shown at times t = {0, 50, 100, 200, 400} Myr (going from top to bottom) for a simulation affected by an asymmetric perturbation at time t = 0 Myr. Left and right panels: (a) a histogram of the total stellar density with bin size (20 pc)×(1 km s−1); and (b) the difference between the stellar density histogram and the average of the surrounding histogram bins. All panels have the same coordinate axis. The colour scheme in the panels on the right-hand side is not linear, but in arcsinh scale.
Current usage metrics show cumulative count of Article Views (full-text article views including HTML views, PDF and ePub downloads, according to the available data) and Abstracts Views on Vision4Press platform.
Data correspond to usage on the plateform after 2015. The current usage metrics is available 48-96 hours after online publication and is updated daily on week days.
Initial download of the metrics may take a while.