Fig. 5.
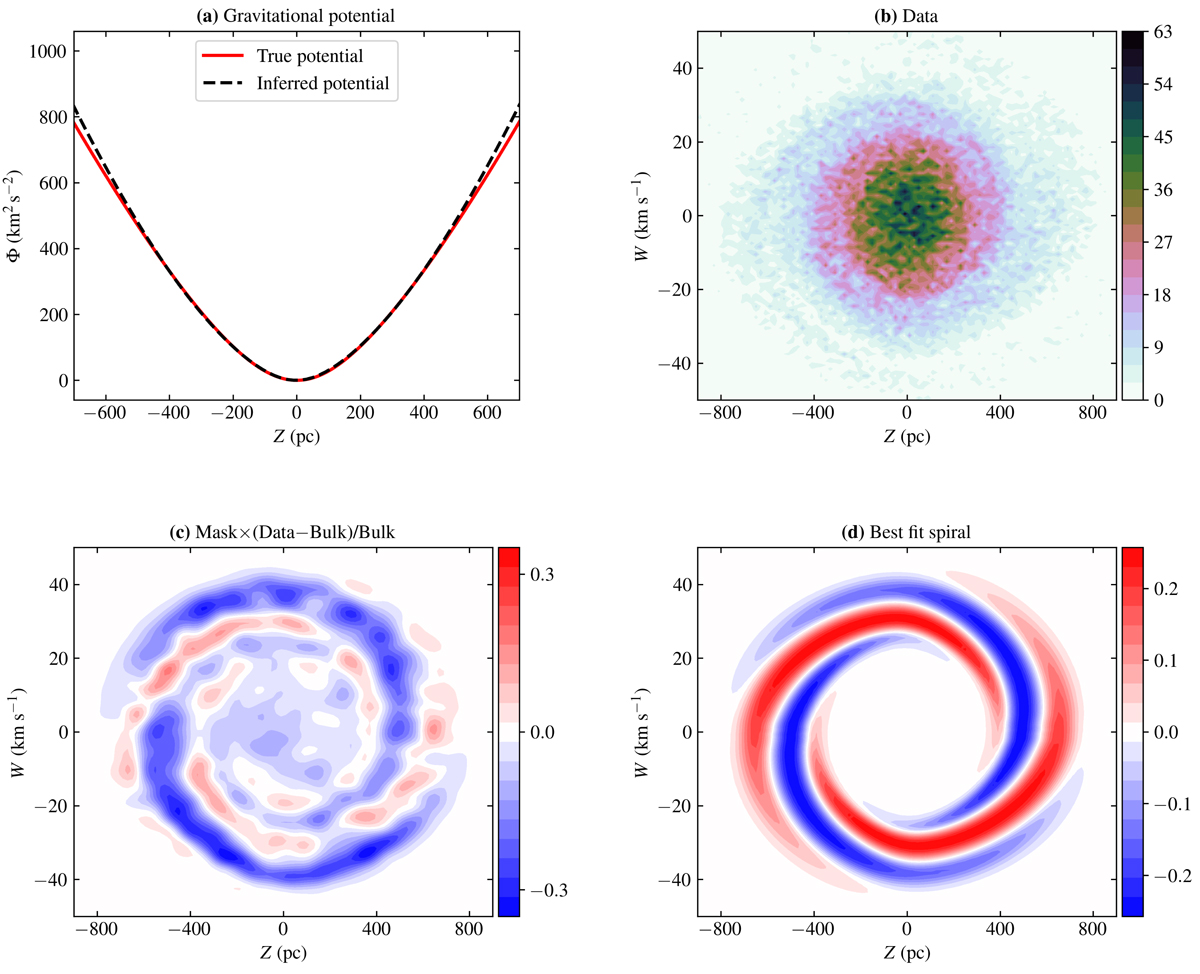
Data and results of simulation A at time tA, 1 = 400 Myr. The four panels show: (a) the true and inferred gravitational potentials; (b) the two-dimensional data histogram di, j in the (Z, W)-plane; (c) the phase-space spiral as extracted from the data (see Eq. (25) for the precise definition) and smoothed to an effective bin size of (40 pc)×(2 km s−1); and (d) the best fit spiral density S(Z + Z⊙, W + W⊙ | Ψspiral), as defined in Eq. (26). Panel a: the height is plotted in the range Z ∈ [ − 700, 700] pc, corresponding to the outer limit of the mask function; in all other panels, the range is Z ∈ [ − 900, 900] pc. Panels c and d: the outer boundary corresponds to that of the mask function of Eq. (17); panel d: the inner boundary corresponds to the lower limit in vertical energy for the spiral model, according to Eq. (14).
Current usage metrics show cumulative count of Article Views (full-text article views including HTML views, PDF and ePub downloads, according to the available data) and Abstracts Views on Vision4Press platform.
Data correspond to usage on the plateform after 2015. The current usage metrics is available 48-96 hours after online publication and is updated daily on week days.
Initial download of the metrics may take a while.