Fig. A.1
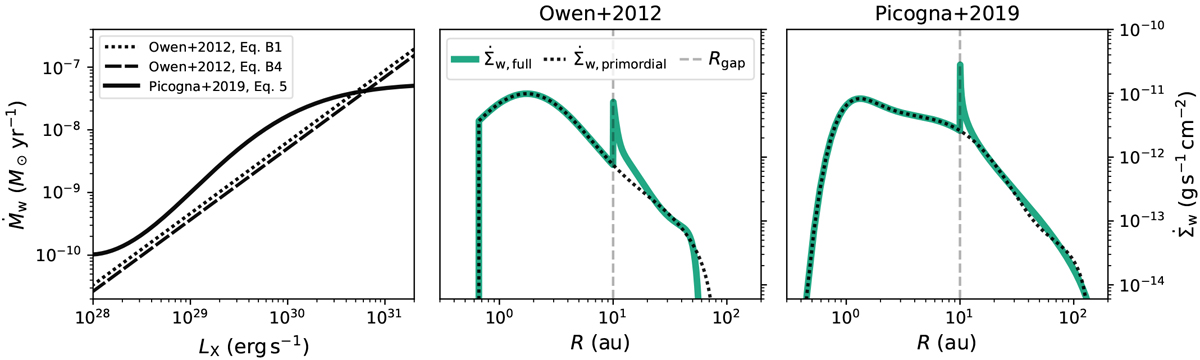
Comparison of the integrated mass loss rates as a function of the X-ray luminosity (left panel) and the surface mass loss profiles as a function of disc radius (centre and right panel) for the photoevaporation profiles by Owen et al. (2012) and Picogna et al. (2019). For the plots showing
![]() it is assumed that photoevaporation already opened a gap in the disc, which has moved up to 10 au, while theinner disc was drained. At this point, the inner edge of the outer disc is located at 10 au, and the column density of the inner disc is less than 2.5 × 1022 cm−2. Inside of 10 au the primordial profile is active (Eqs. (A.2) and (A.8), respectively), and outside of 10 au the transition disc profile (Eqs. (A.5) and (A.10), respectively). The solid lines show the total mass loss profile, while the dotted lines only highlight the primordial profile for each case (i.e. assuming photoevaporation had not opened a gap and the disc is still in its primordial stage).
it is assumed that photoevaporation already opened a gap in the disc, which has moved up to 10 au, while theinner disc was drained. At this point, the inner edge of the outer disc is located at 10 au, and the column density of the inner disc is less than 2.5 × 1022 cm−2. Inside of 10 au the primordial profile is active (Eqs. (A.2) and (A.8), respectively), and outside of 10 au the transition disc profile (Eqs. (A.5) and (A.10), respectively). The solid lines show the total mass loss profile, while the dotted lines only highlight the primordial profile for each case (i.e. assuming photoevaporation had not opened a gap and the disc is still in its primordial stage).
Current usage metrics show cumulative count of Article Views (full-text article views including HTML views, PDF and ePub downloads, according to the available data) and Abstracts Views on Vision4Press platform.
Data correspond to usage on the plateform after 2015. The current usage metrics is available 48-96 hours after online publication and is updated daily on week days.
Initial download of the metrics may take a while.