Fig. 4
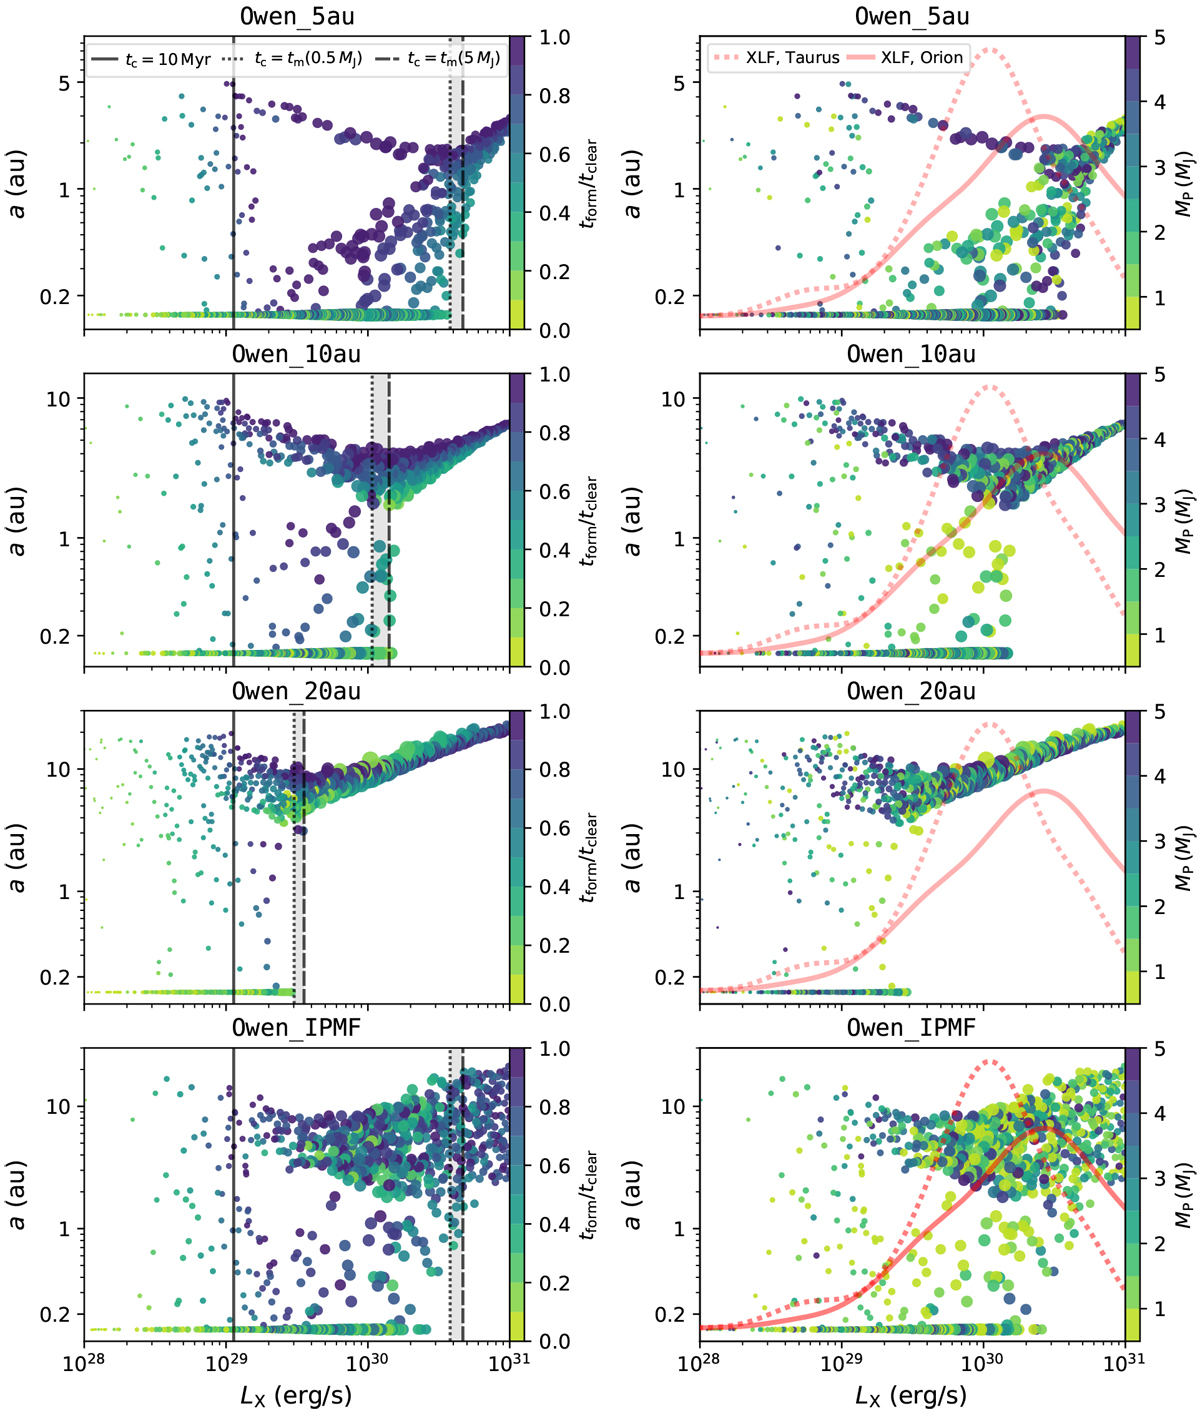
Comparison of the final LX–a-distributions for the Owen_XX models using the photoevaporation profile by O12. The different rows show the outcomes of the population synthesis models using different insertion locations of the planets (5 au, 10 au, 20 au and random insertion locations). Colours in the left column correspond to the formation time of the planet with respect to the disc clearing time due to photoevaporation. In the right column, colours reflect the initial planetary mass. The black lines highlight the different regimes, in which the final planet parking location is set by different effects. These are discussed in detail in Sect. 4.1. The red lines in the right panels correspond to the XLFs as shown in Fig. 3. Additionally, the data points were weighted linearly following the XLF in Taurus so that their size reflects the observing probability at a given LX. This step was performed in order to emphasise which regions in LX-parameter space are strongly over-crowded due to the linear sampling ofX in our model.
Current usage metrics show cumulative count of Article Views (full-text article views including HTML views, PDF and ePub downloads, according to the available data) and Abstracts Views on Vision4Press platform.
Data correspond to usage on the plateform after 2015. The current usage metrics is available 48-96 hours after online publication and is updated daily on week days.
Initial download of the metrics may take a while.