Fig. 2
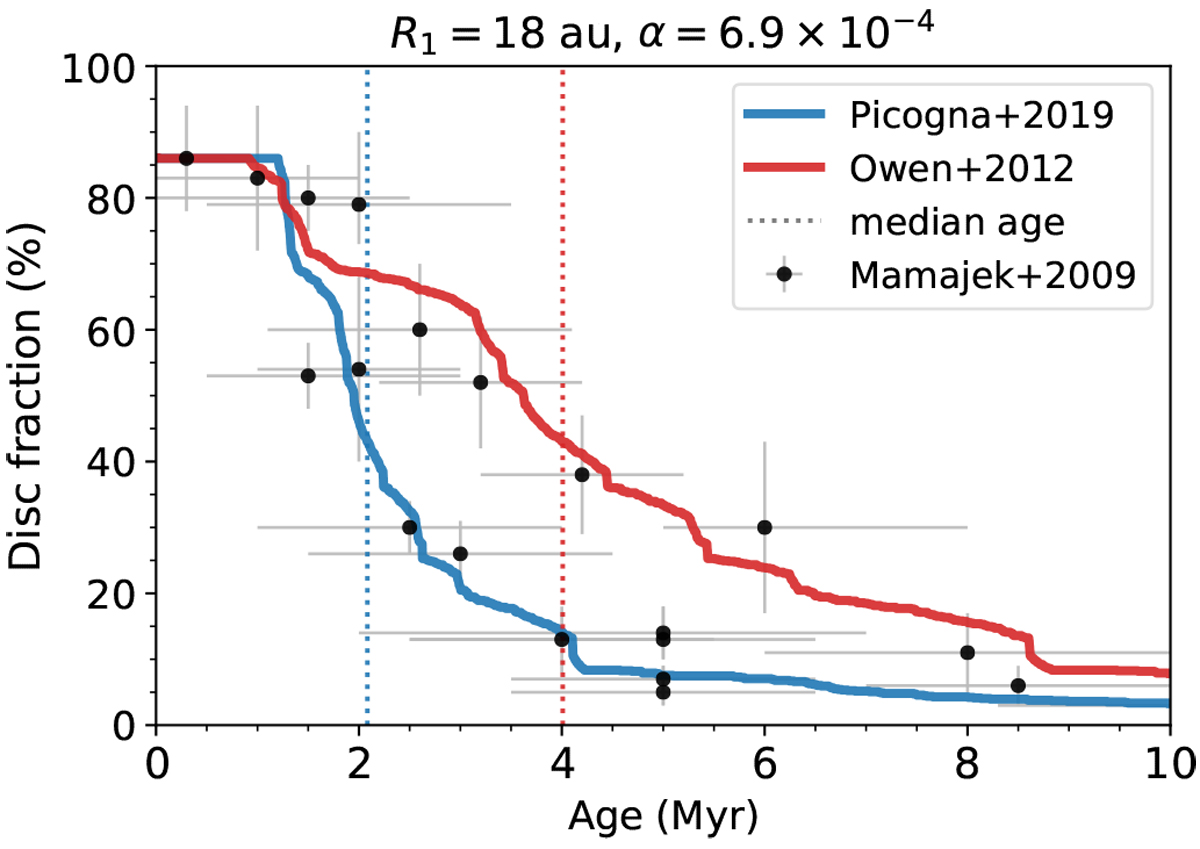
Disc fraction as a function of time from two evolving disc populations using the XPE profiles by P19 (solid blue line) and O12 (solid red line). For each model, 1000 simulations were performed, using different X-ray luminosities that were sampled randomly from the XLF of Taurus. The dotted lines show the corresponding median disc lifetimes of each distribution. The black dots show observed disc fractions compiled by Mamajek (2009). The simulated disc fractions were scaled to 86% in order to account for binary interactions (cf. Owen et al. 2011).
Current usage metrics show cumulative count of Article Views (full-text article views including HTML views, PDF and ePub downloads, according to the available data) and Abstracts Views on Vision4Press platform.
Data correspond to usage on the plateform after 2015. The current usage metrics is available 48-96 hours after online publication and is updated daily on week days.
Initial download of the metrics may take a while.