Fig. 1
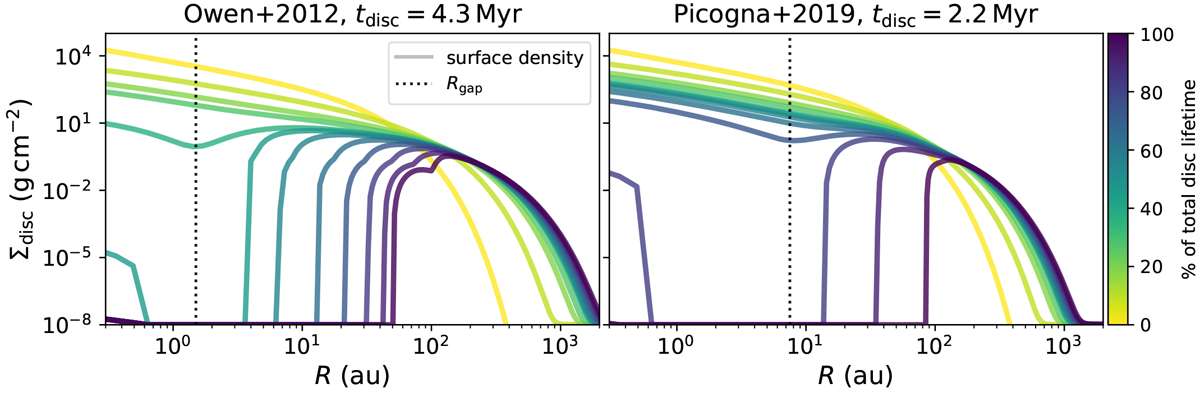
Comparison of the 1D surface density evolution as a function of disc radius for a planet-less disc of Md = 0.07 M⊙, using LX = 1 × 1030 erg s−1 for the photoevaporation profiles by O12 and P19. The different lines are drawn at [0, 25, 50, 60, 70, 72, 75, 80, 85, 90, 95, 99]% of the corresponding total disc lifetime tdisc. The dotted line shows the approximate location of gap opening due to photoevaporation for each model.
Current usage metrics show cumulative count of Article Views (full-text article views including HTML views, PDF and ePub downloads, according to the available data) and Abstracts Views on Vision4Press platform.
Data correspond to usage on the plateform after 2015. The current usage metrics is available 48-96 hours after online publication and is updated daily on week days.
Initial download of the metrics may take a while.