Fig. 4.
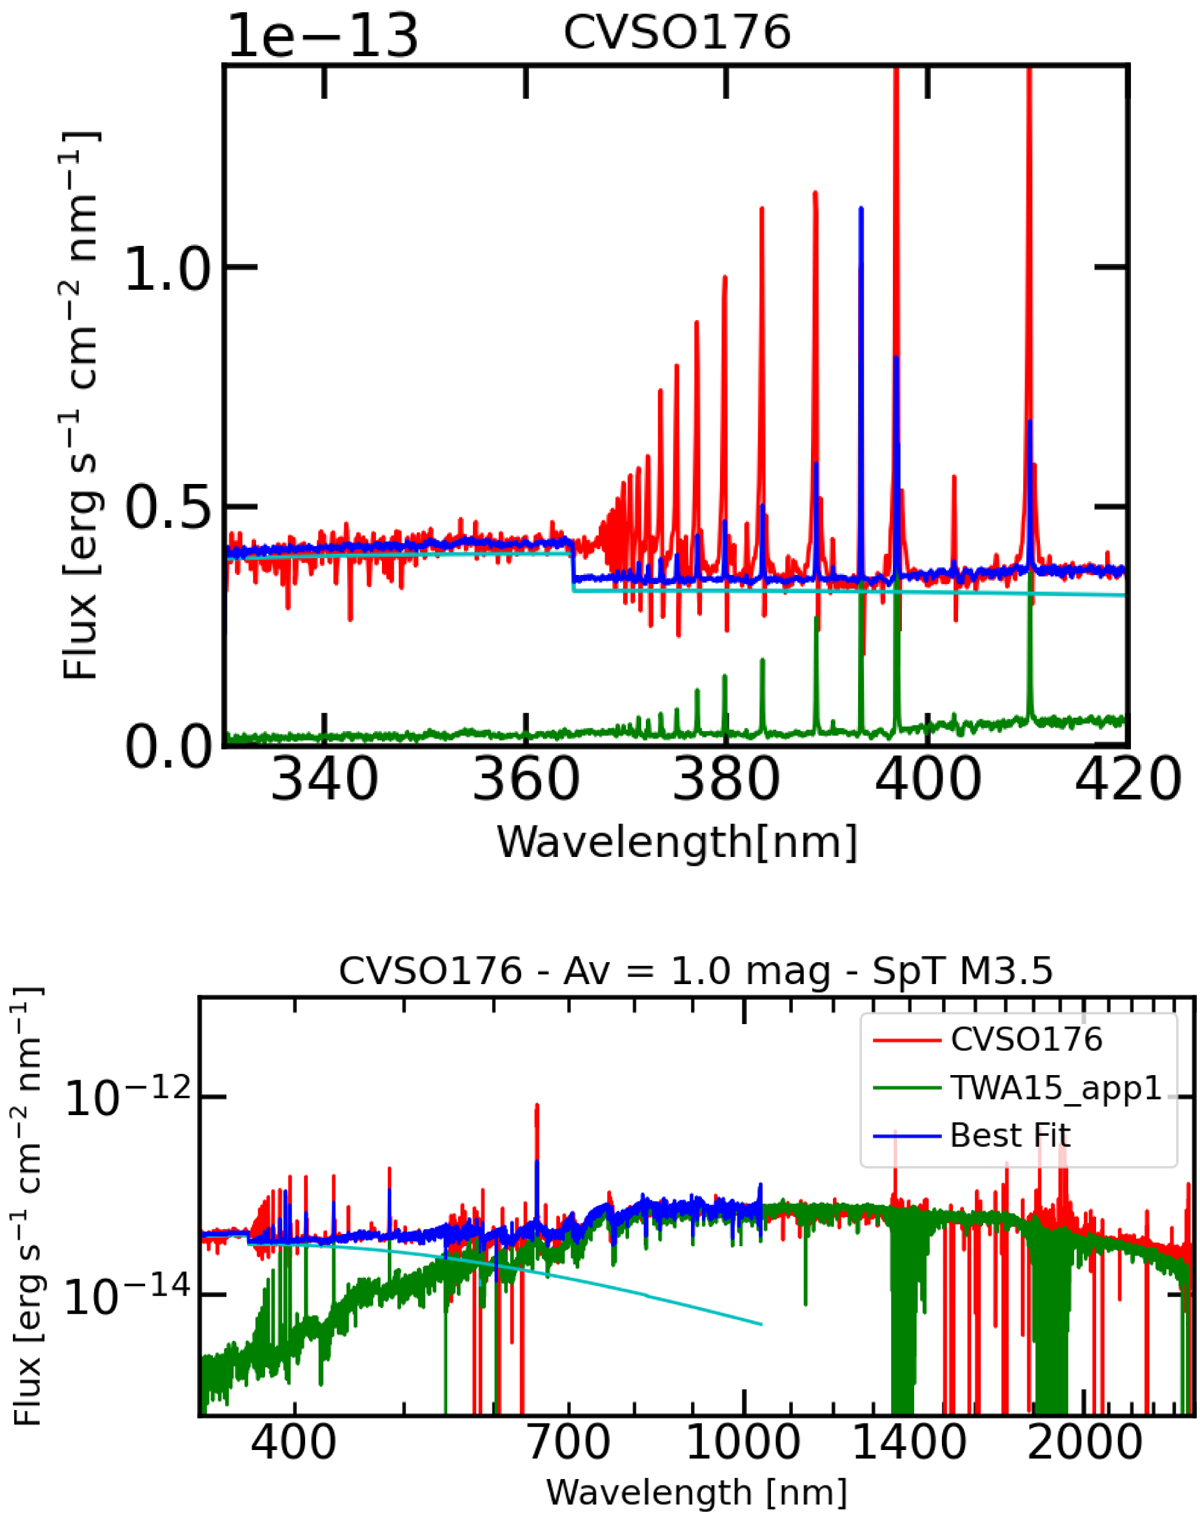
Example of a best fit for the X-shooter spectrum of CVSO 176 obtained with the fitter described in Sect. 2.5.1. The spectrum of the target is shown with a red line, the best fit photospheric template with a green line, the slab model with a cyan line, and the best-fit sum of the template and slab model with a blue line. The best fit is only shown up to 1000 nm, since the contribution from the disk emission can be significant at longer wavelengths.
Current usage metrics show cumulative count of Article Views (full-text article views including HTML views, PDF and ePub downloads, according to the available data) and Abstracts Views on Vision4Press platform.
Data correspond to usage on the plateform after 2015. The current usage metrics is available 48-96 hours after online publication and is updated daily on week days.
Initial download of the metrics may take a while.