Fig. 3.
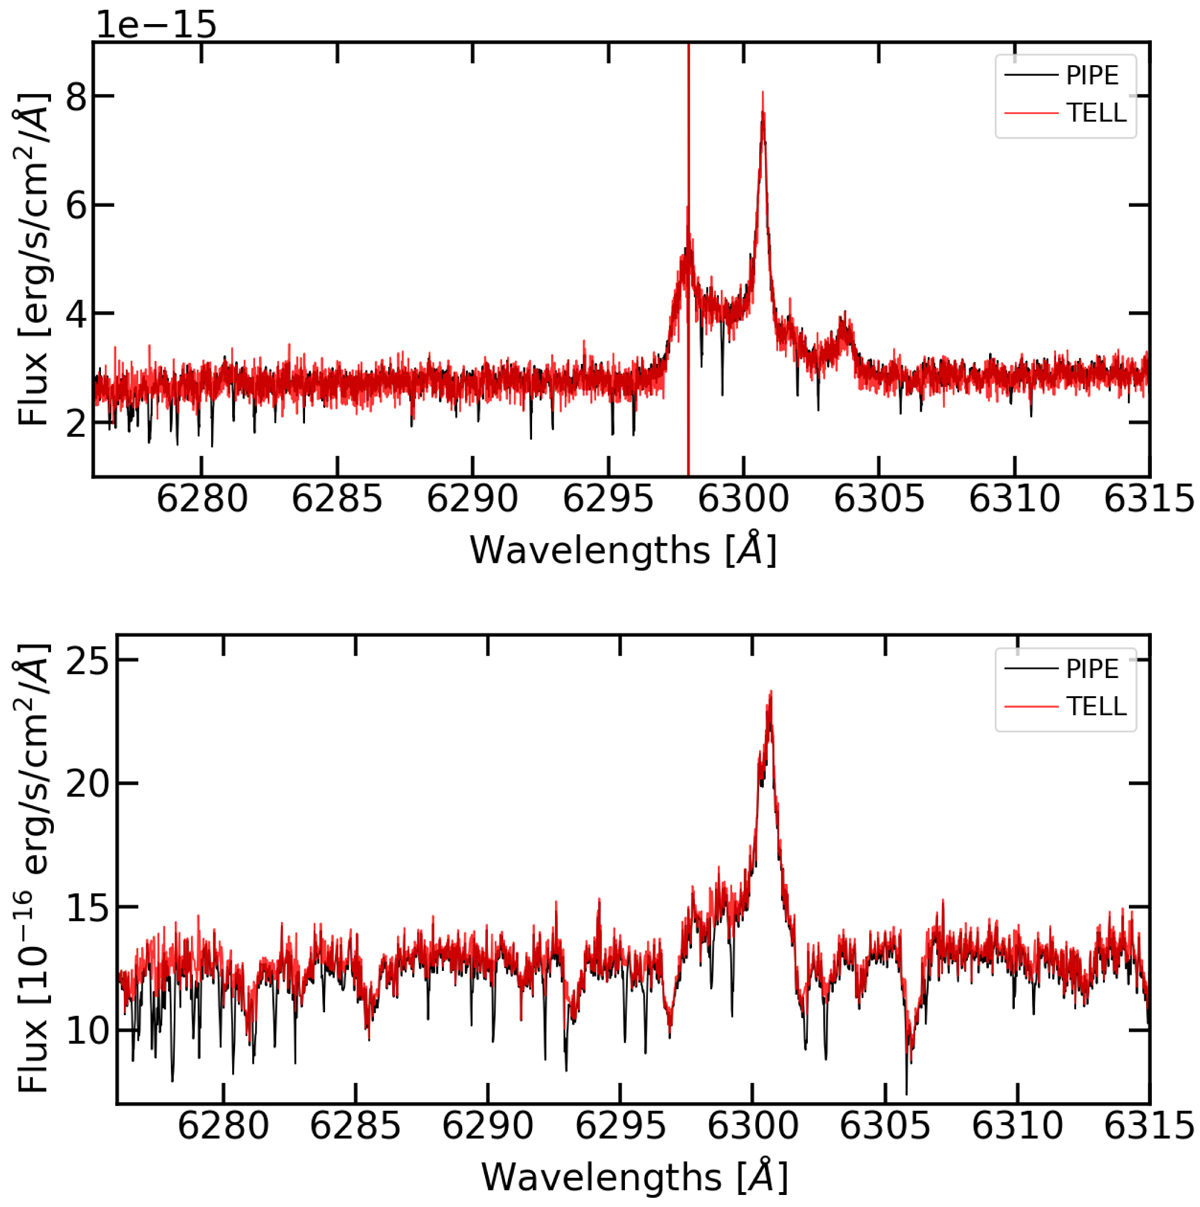
Example of telluric correction in the region of the [OI]6300 Å line for the ESPRESSO spectrum of CVSO 90 performed with molecfit (top) and for the UVES spectrum of CVSO 58 carried out with a standard telluric (bottom). The black spectrum is obtained from the pipeline reduction, and the red one shows the telluric corrected spectrum.
Current usage metrics show cumulative count of Article Views (full-text article views including HTML views, PDF and ePub downloads, according to the available data) and Abstracts Views on Vision4Press platform.
Data correspond to usage on the plateform after 2015. The current usage metrics is available 48-96 hours after online publication and is updated daily on week days.
Initial download of the metrics may take a while.