Fig. 1.
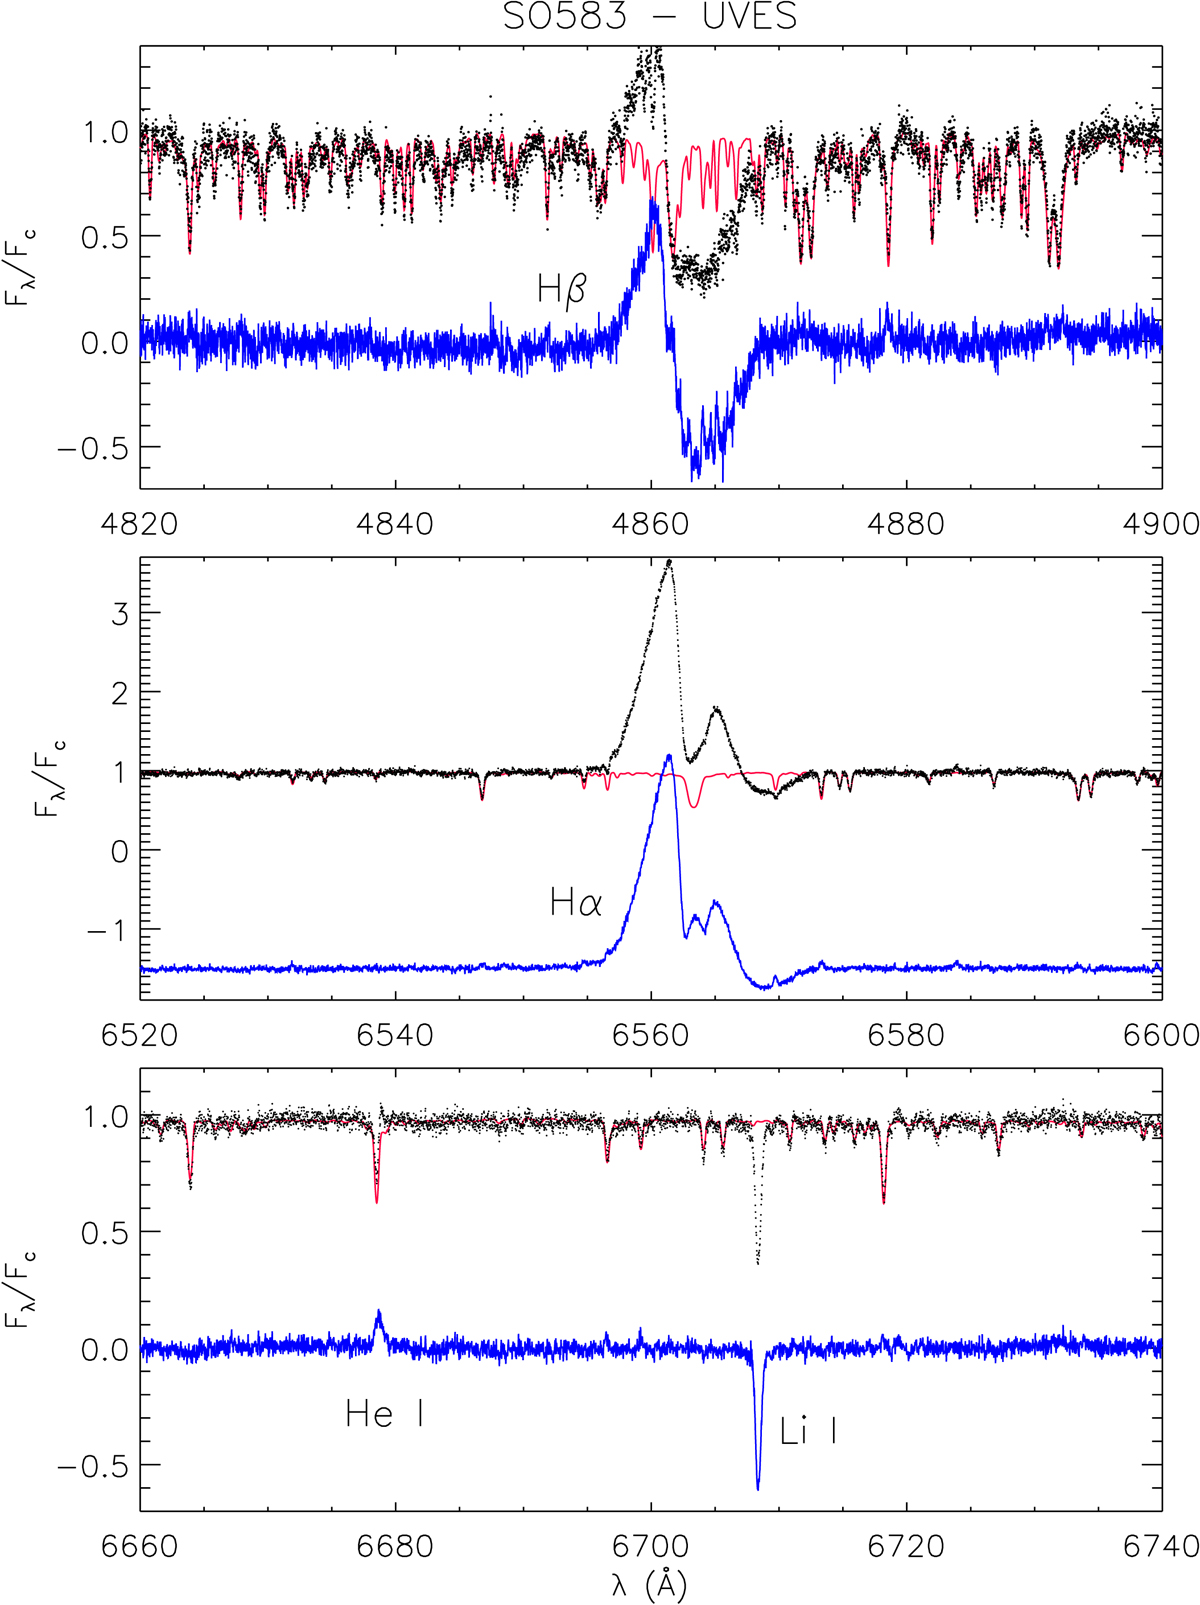
Subtraction of the non-active, lithium-poor template (red line) from the spectrum of SO 583 (black dots), which reveals the complex structure of the Hβ and Hα lines (blue lines in the upper and central panel, respectively) and emphasizes the Li Iλ6707.8 Å absorption line, removing the nearby blended lines (bottom panel). The He Iλ6678.2 Å emission line clearly emerges in the subtracted spectrum.
Current usage metrics show cumulative count of Article Views (full-text article views including HTML views, PDF and ePub downloads, according to the available data) and Abstracts Views on Vision4Press platform.
Data correspond to usage on the plateform after 2015. The current usage metrics is available 48-96 hours after online publication and is updated daily on week days.
Initial download of the metrics may take a while.