Free Access
Fig. 4.
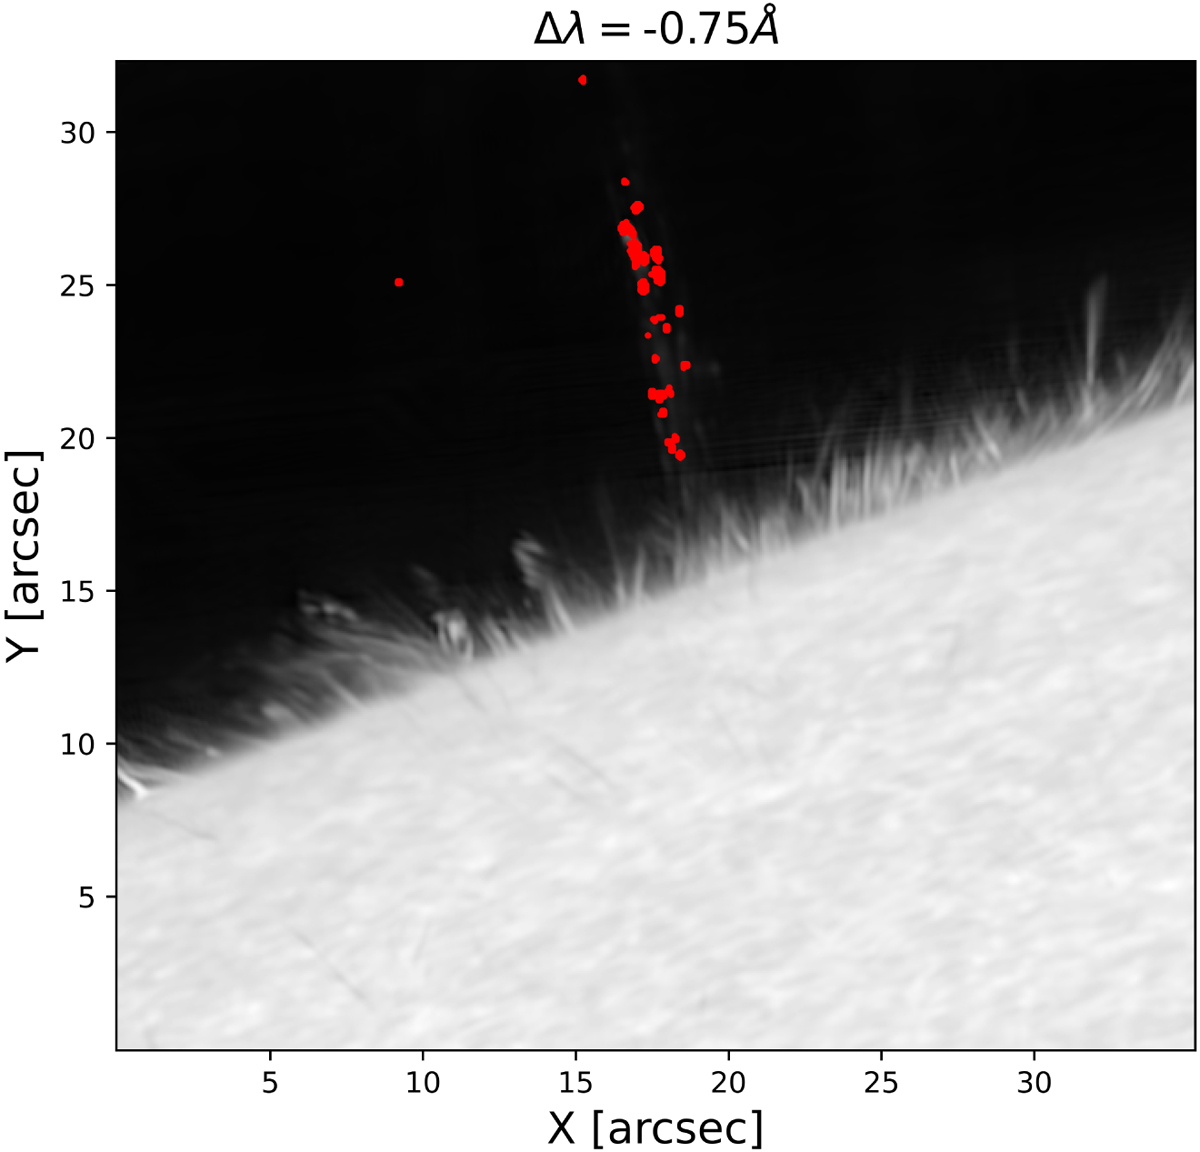
Logarithm of the intensity at 16:40:55 UT in the same way as Fig. 1. The red dots correspond to the positions where the magnetic field was inferred and/or a clump was detected in at least one scan.
Current usage metrics show cumulative count of Article Views (full-text article views including HTML views, PDF and ePub downloads, according to the available data) and Abstracts Views on Vision4Press platform.
Data correspond to usage on the plateform after 2015. The current usage metrics is available 48-96 hours after online publication and is updated daily on week days.
Initial download of the metrics may take a while.