Fig. 3.
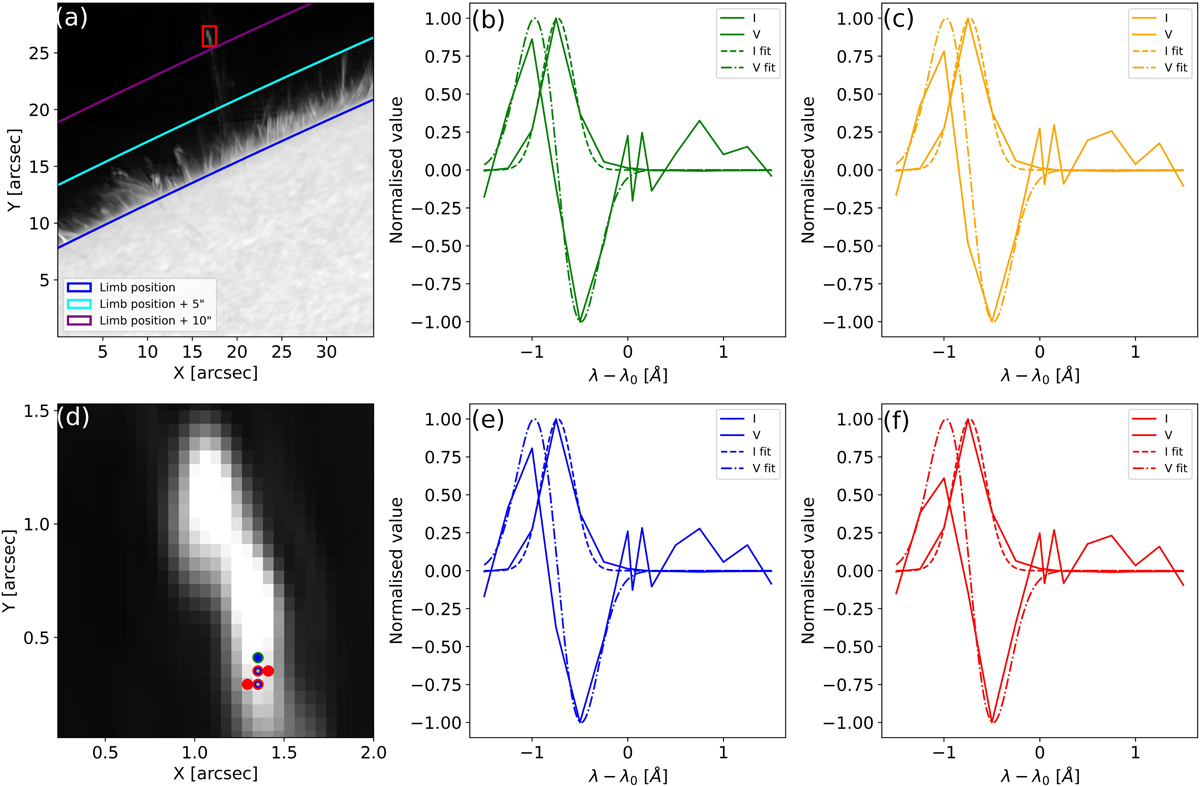
Example of a coronal rain clump present in the observations and the averaging of the Stokes I and V profiles in groups of adjacent pixels. Panel a: coronal rain clump at −0.75 Å from the line centre from an image taken at 16:40:55 UT. Panel d: magnified view of the red rectangle of panel a in order to enhance the view of the clump. Panels b, c, e, and f: Stokes I and V profiles normalised to their respective maxima as they appear when averaging the signal from one, two, three, and four pixels, respectively. The colour of the I profile matches the colour of the pixel (or group of pixels) on which the signal is averaged in order to generate the profile as shown on panel d. The continuous lines reflect the observed profiles, while the dashed lines depict the profiles that result from fitting I and V with a Gaussian profile and the derivative of a Gaussian profile, respectively.
Current usage metrics show cumulative count of Article Views (full-text article views including HTML views, PDF and ePub downloads, according to the available data) and Abstracts Views on Vision4Press platform.
Data correspond to usage on the plateform after 2015. The current usage metrics is available 48-96 hours after online publication and is updated daily on week days.
Initial download of the metrics may take a while.