Fig. 1.
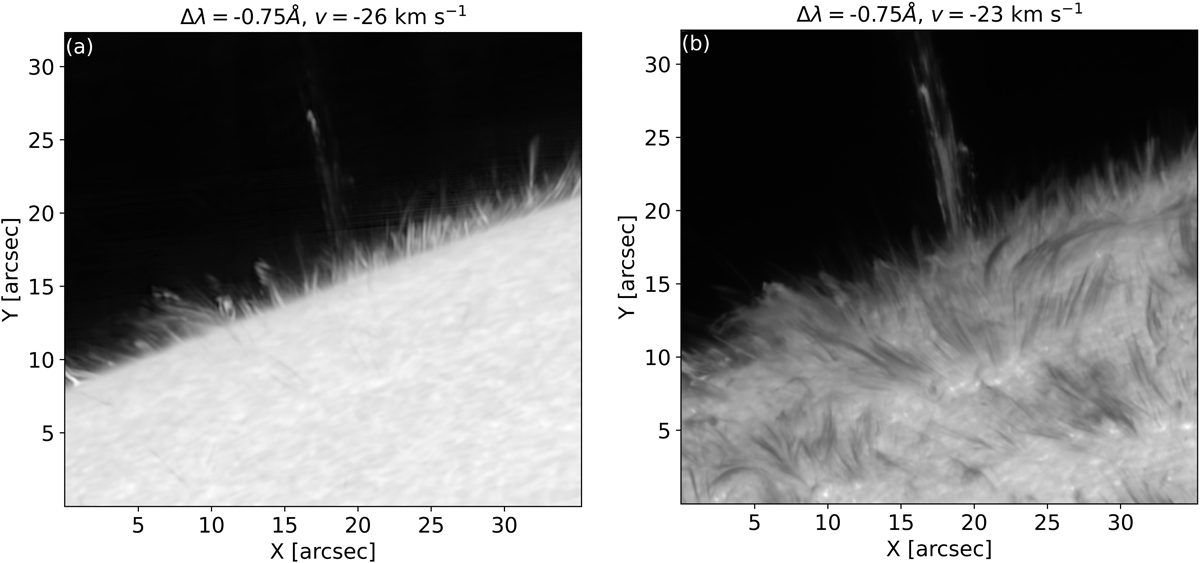
Evolution of coronal rain during the observations. Panel a: Ca II 8542 Å line at 16:40:55 UT and panel b: in the Hα at 16:40:41 UT. The logarithm of the intensity is shown in panel a to enhance the appearance of the clumps, which otherwise would not be visible due to the much larger average intensity from the disc. An animation associated with the observations is available online, where the Ca II 8542 Å intensity shown in a copper coloured table is superposed on the Hα intensity displayed in a grey coloured table.
Current usage metrics show cumulative count of Article Views (full-text article views including HTML views, PDF and ePub downloads, according to the available data) and Abstracts Views on Vision4Press platform.
Data correspond to usage on the plateform after 2015. The current usage metrics is available 48-96 hours after online publication and is updated daily on week days.
Initial download of the metrics may take a while.