Fig. 5.
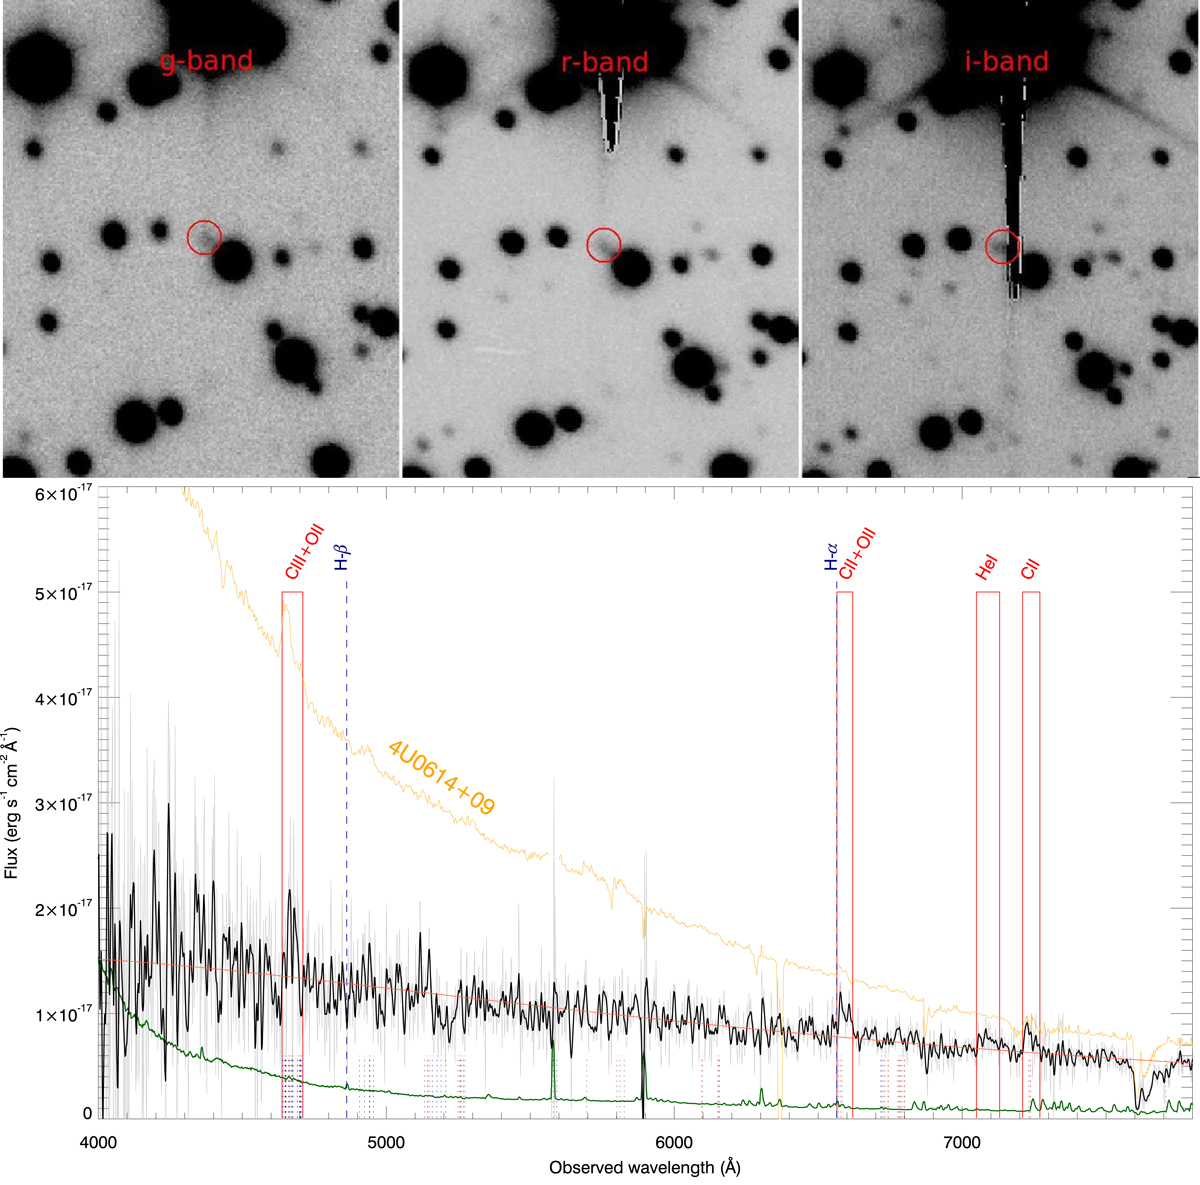
Top: optical images acquired by GTC/OSIRIS on 2020 February 18. Saturation blooming due to a nearby star is evident in the i-band image. The position of J0840 is marked with a red circle. North is up, east to the left. Bottom: extinction-corrected optical spectrum of J0840 in quiescence plotted together with a spectrum of the UCXB 4U 0614+091 acquired in archival observations with VLT/X-shooter. The original data are indicated in grey, the same data convolved with a Gaussian function of width 5 Å are marked in black. The best fitting blackbody model for the continuum of J0840 is overplotted with an orange line. The most prominent emission features of J0840 are labelled in red. The wavelengths of the Hα and Hβ lines are marked in blue. The carbon and oxygen lines identified by Nelemans et al. (2004) are marked using brown and blue dotted lines. The broad absorption feature at ∼7600 Å is due to the telluric (atmospheric) O2 absorption feature.
Current usage metrics show cumulative count of Article Views (full-text article views including HTML views, PDF and ePub downloads, according to the available data) and Abstracts Views on Vision4Press platform.
Data correspond to usage on the plateform after 2015. The current usage metrics is available 48-96 hours after online publication and is updated daily on week days.
Initial download of the metrics may take a while.