Fig. 2.
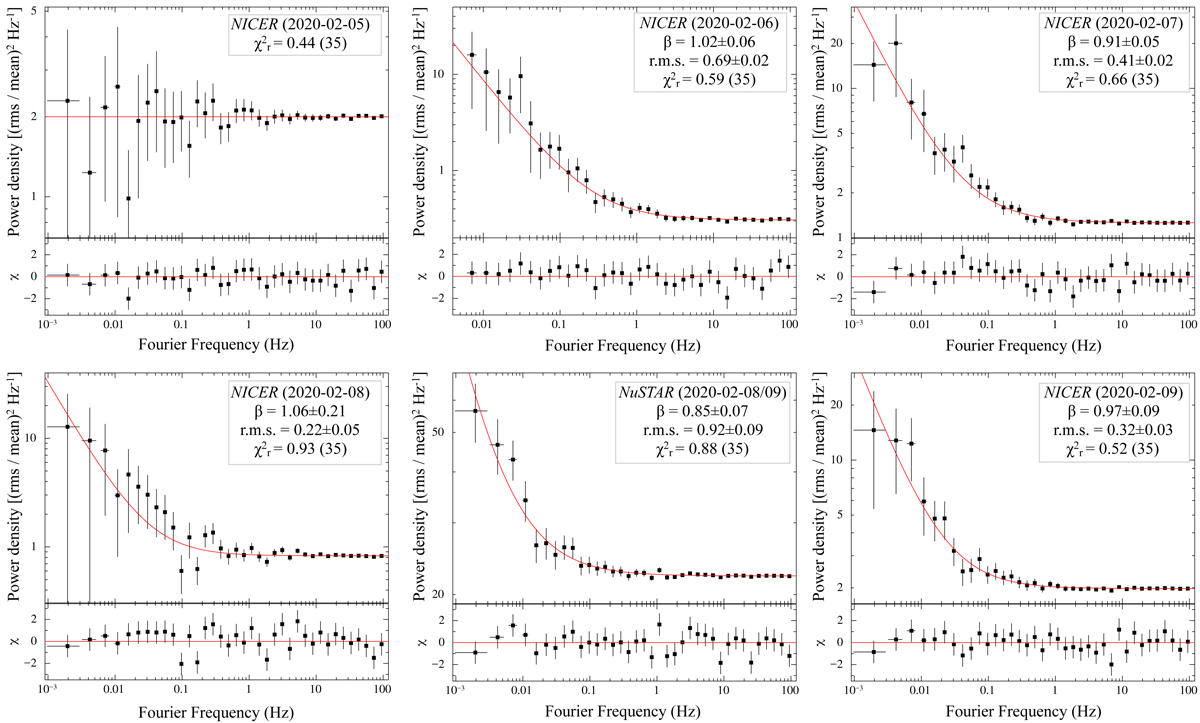
Power density spectra extracted from NICER (0.5−5 keV) and NuSTAR (3−20 keV) data. The red solid lines mark the best-fitting model to the power spectra (see text for details). The best-fitting values for the power-law index, the rms variability amplitudes below 1 Hz and the ![]() values with the d.o.f. of the fits are also shown. Post-fit residuals are shown in the bottom panels. Uncertainties are at 1σ c.l.
values with the d.o.f. of the fits are also shown. Post-fit residuals are shown in the bottom panels. Uncertainties are at 1σ c.l.
Current usage metrics show cumulative count of Article Views (full-text article views including HTML views, PDF and ePub downloads, according to the available data) and Abstracts Views on Vision4Press platform.
Data correspond to usage on the plateform after 2015. The current usage metrics is available 48-96 hours after online publication and is updated daily on week days.
Initial download of the metrics may take a while.