Fig. 1.
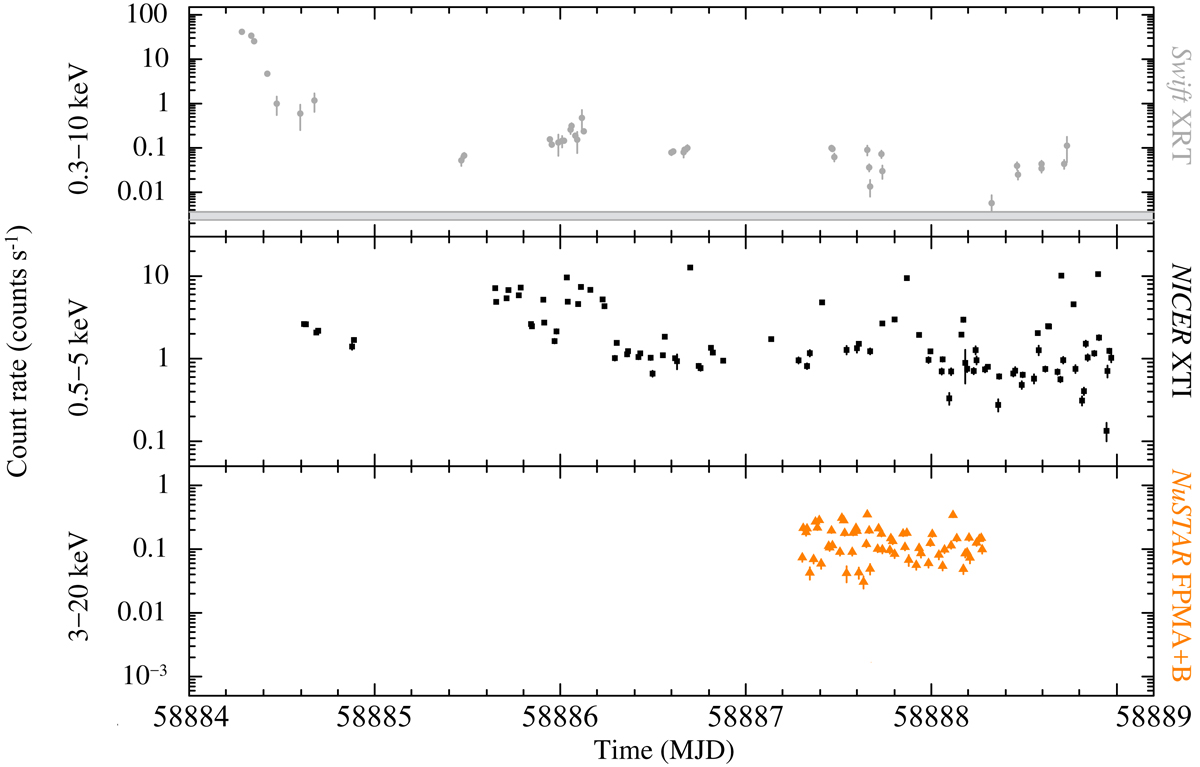
Multi-instrument background-subtracted X-ray light curves of J0840 between 2020 February 5−10, binned at 800 s. The grey shaded region in the top panel indicates the confidence interval (at 3σ) for the quiescent Swift/XRT net count rate computed by stacking all observations performed since 2020 February 10 (see Table 1). In most cases, the marker size is larger than the error bars.
Current usage metrics show cumulative count of Article Views (full-text article views including HTML views, PDF and ePub downloads, according to the available data) and Abstracts Views on Vision4Press platform.
Data correspond to usage on the plateform after 2015. The current usage metrics is available 48-96 hours after online publication and is updated daily on week days.
Initial download of the metrics may take a while.