Fig. 6.
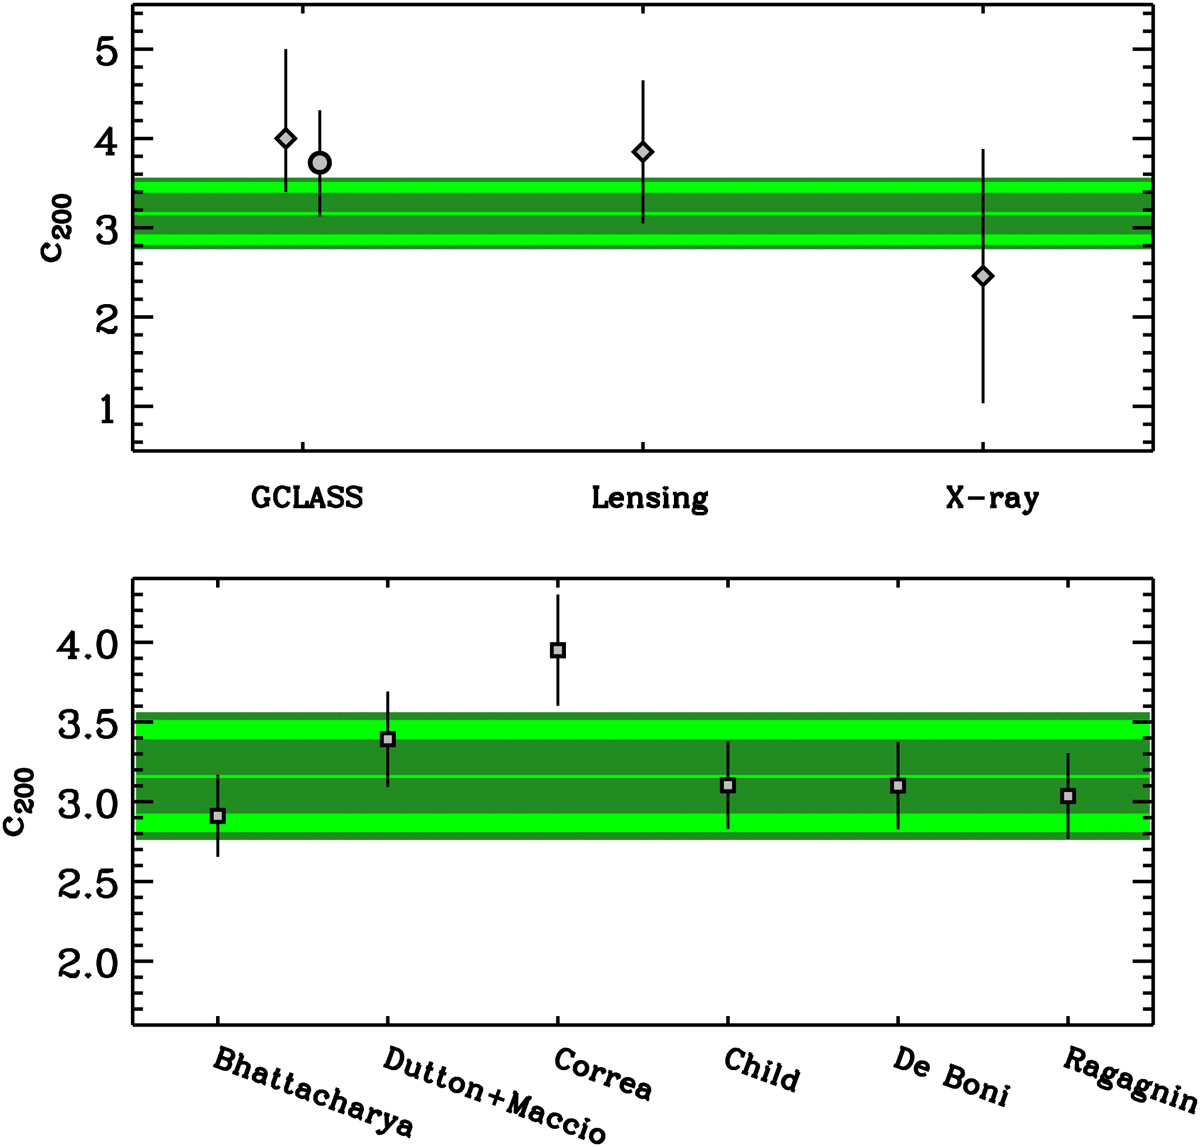
The concentration of the ensemble cluster compared to previous observational results and theoretical predictions. Top panel: green horizontal line: ℒ-weighted average c200 for the ensemble cluster. Shadings represent the 1σ error bar on the c200, with contributions from the three terms, δc, s, δc, ν, and δc, j (inner dark green shading, intermediate light green shading, and external dark green shading, respectively). The two symbols with 1σ error bars labeled “GCLASS” represent the results of the dynamical analysis of GCLASS clusters, as obtained by B+16 (diamond) and as obtained in this work by including the new GOGREEN survey data for the GCLASS clusters. The symbols and 1σ error bars labelled “Lensing” and “X-ray” represent mean values from the literature for clusters in the same r200 and z range as the clusters in our sample, obtained through the analysis of gravitational lensing and X-ray data, respectively (references are given in the text). Bottom panel: green horizontal line and shadings as in the top panel. Symbols with 1σ error bars are theoretical predictions from Bhattacharya et al. (2013), Dutton & Macciò (2014), Correa et al. (2015), Child et al. (2018), De Boni et al. (2013), Ragagnin et al. (2021) for a halo of the same M200 and z as our ensemble cluster, and rescaled to the cosmological parameters used in this paper.
Current usage metrics show cumulative count of Article Views (full-text article views including HTML views, PDF and ePub downloads, according to the available data) and Abstracts Views on Vision4Press platform.
Data correspond to usage on the plateform after 2015. The current usage metrics is available 48-96 hours after online publication and is updated daily on week days.
Initial download of the metrics may take a while.