Fig. 5.
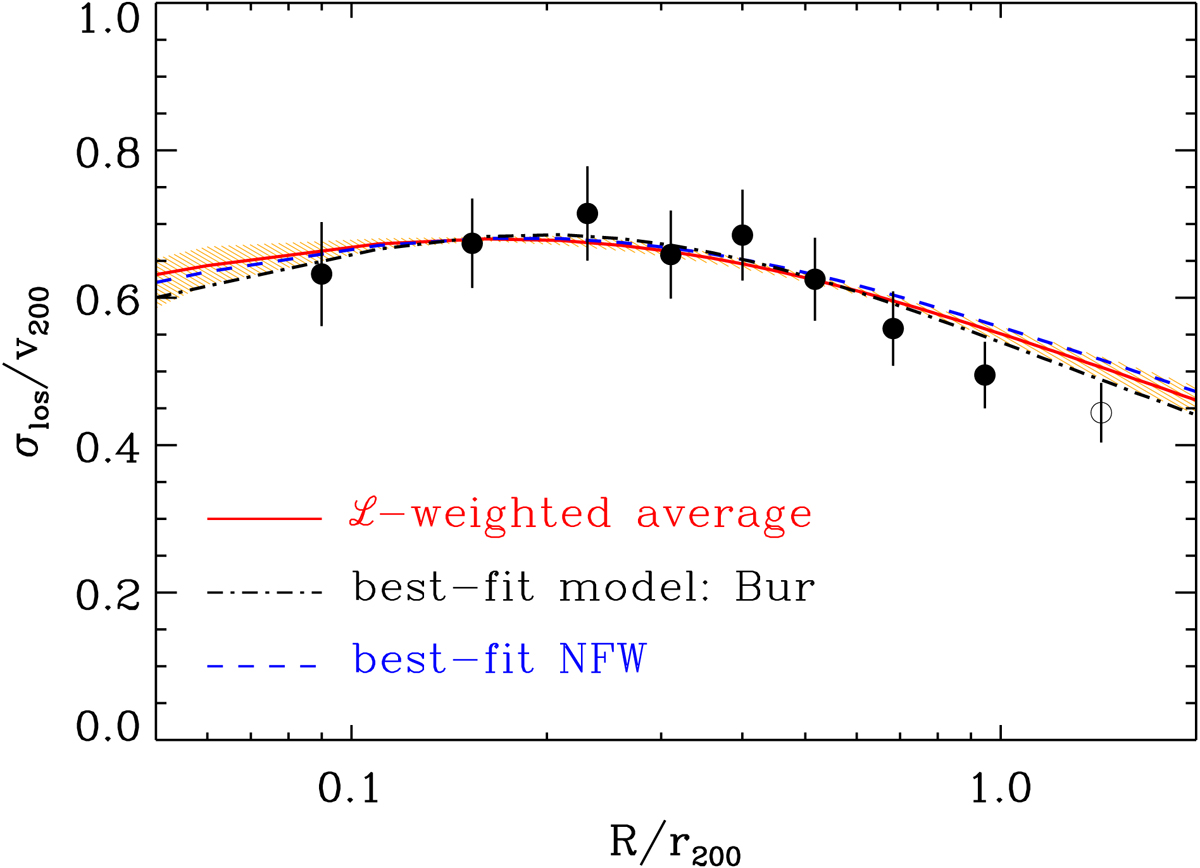
Line-of-sight velocity dispersion profile of the ensemble cluster (dots and 1σ error bars, estimated using Eq. (16) in Beers et al. 1990). Also shown are the MAMPOSSt results for M(r) and β(r) projected onto the velocity dispersion profile. Red curve and orange shading: ℒ-weighted average of all 35 best-fit model M(r) from the MAMPOSSt analysis, and 1σ error (reduced χ2 = 0.6). Blue dashed curve: highest-ℒ among NFW models (reduced χ2 = 0.7). Black dot-dashed curve: highest-ℒ model (Burkert, reduced χ2 = 0.4). The last point (empty dot) represents the velocity dispersion of galaxies that were not used in the MAMPOSSt analysis because they are at R ≥ r200.
Current usage metrics show cumulative count of Article Views (full-text article views including HTML views, PDF and ePub downloads, according to the available data) and Abstracts Views on Vision4Press platform.
Data correspond to usage on the plateform after 2015. The current usage metrics is available 48-96 hours after online publication and is updated daily on week days.
Initial download of the metrics may take a while.