Fig. 1.
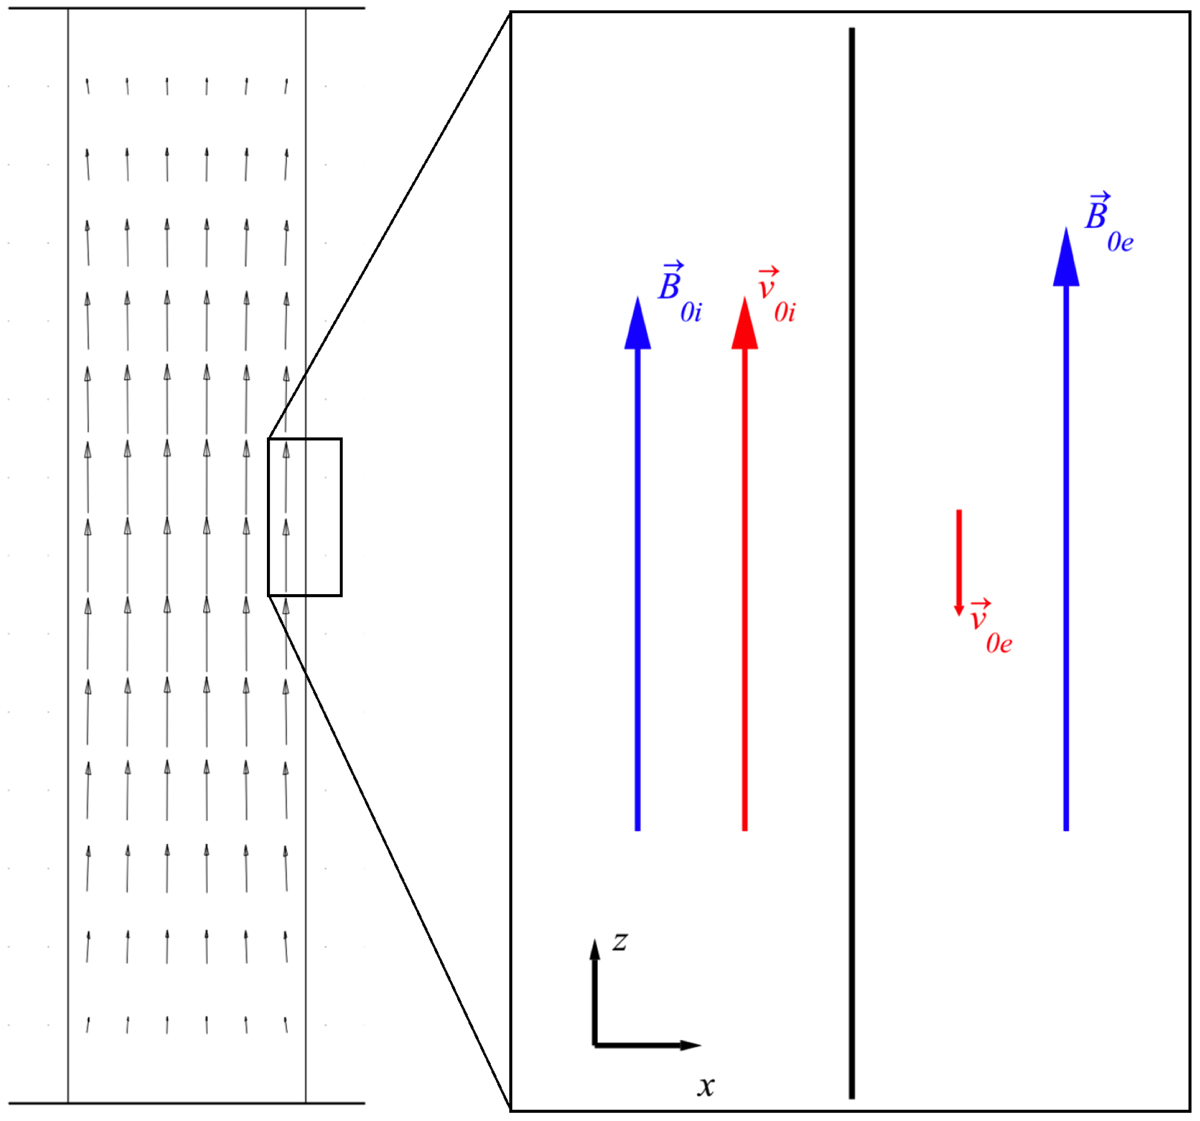
Sketch of a longitudinal cut along the axis of a coronal loop harboring a fundamental standing slow body sausage mode, at the velocity’s maximal amplitude (left) and the local cartesian model at the boundary (right). The arrows on the left represent the velocity field and their lengths are to scale with the relative local magnitude of the field for a slow body sausage mode at a given time. The lengths and directions of the magnetic field arrows on the right figure are consistent for that same slow mode, whereas for the velocity arrows only the direction is consistent (the length of the exterior velocity arrow having been increased for visual clarification).
Current usage metrics show cumulative count of Article Views (full-text article views including HTML views, PDF and ePub downloads, according to the available data) and Abstracts Views on Vision4Press platform.
Data correspond to usage on the plateform after 2015. The current usage metrics is available 48-96 hours after online publication and is updated daily on week days.
Initial download of the metrics may take a while.